


End-to-End Observability in .NET with Aspire, OpenTelemetry, and the LGTM Stack

Mehdi Hadeli
@mehdihadeli
On this page
Table of contents
Introduction
Observability is not a feature you bolt on after launch — it is a first-class concern that shapes how you debug, monitor, and operate your system. In the .NET ecosystem, the combination of .NET Aspire, OpenTelemetry (OTel), and the OpenTelemetry Collector gives you a vendor-neutral pipeline that exports telemetry to any backend you choose.
In this article, we use two samples. The Simple API OTLP sample is a small AppHost-free example that demonstrates the minimum setup for exporting application telemetry to an OTLP Collector. The more complete AspireShop sample is a microservices e-commerce app with a catalog service, basket service, and a Blazor frontend; it is the main sample used for the end-to-end walkthrough. We stand up a full observability stack using Docker Compose, configure the OTel Collector to fan out traces, metrics, and logs to Prometheus, Tempo, Loki, and Grafana (the LGTM stack). As a bonus, we keep an ELK stack (Elasticsearch + Kibana) running alongside as an optional alternative, and we discuss when you would pick one over the other.
Sample code is available in the observability-aspire-opentelemetry-dotnet sample repository, including the simple-api-otlp sample and the complete aspireshop sample.
By the end you will understand:
- How .NET Aspire projects emit OTel telemetry out of the box.
- How to configure the OTel Collector to receive, process, and export signals.
- How to provision Prometheus, Tempo, Loki, and Grafana with Docker Compose.
- How to explore traces, metrics, and logs in Grafana.
- Where the ELK stack fits and why you might choose it instead.
Choosing a Sample
Use the Simple API OTLP sample when you want to understand the smallest useful Aspire ServiceDefaults setup. It contains one ASP.NET Core API, no AppHost, and a /telemetry endpoint that produces a trace, a custom nested activity, a structured log, and built-in metrics.
Use the AspireShop sample for the complete walkthrough in this article. It adds an AppHost, service discovery, PostgreSQL, Redis, a gRPC Basket service, a Catalog service, a Blazor frontend, and the Docker Compose observability stack.
The rest of the article uses AspireShop unless a section explicitly calls out the Simple API OTLP sample.
Architecture Overview
The telemetry pipeline follows a clean fan-out pattern: every .NET service pushes OTLP to the Collector, and the Collector routes each signal type to the appropriate backend.
%%{init: {
  'theme': 'base',
  'themeVariables': {
    'background': '#fafaf7',
    'primaryColor': '#ffffff',
    'primaryTextColor': '#0f172a',
    'primaryBorderColor': '#cbd5e1',
    'lineColor': '#475569',
    'secondaryColor': '#f3f4f6',
    'tertiaryColor': '#f3f4f6',
    'fontFamily': 'Geist, ui-sans-serif, sans-serif',
    'fontSize': '14px',
    'edgeLabelBackground': '#fafaf7',
    'nodeBorder': '2px',
    'mainBkg': '#fafaf7',
    'nodePadding': '12px'
  }
}}%%
graph TB
    subgraph ".NET Aspire Host"
        direction LR
        FW[Frontend<br/>Blazor]
        CS[Catalog<br/>Service]
        BS[Basket<br/>Service]
    end

    subgraph "OpenTelemetry Collector"
        direction LR
        OTLP_R[OTLP Receiver<br/>gRPC :4317 / HTTP :4318]
        PROC[Batch + Transform<br/>Processors]
    end

    subgraph "LGTM Stack"
        direction LR
        PROM[Prometheus<br/>Metrics]
        TEMPO[Tempo<br/>Traces]
        LOKI[Loki<br/>Logs]
        GRAF[Grafana<br/>Dashboards]
        MINIO[MinIO<br/>Object Storage]
    end

    subgraph "Optional: ELK Stack"
        direction LR
        ES[Elasticsearch]
        KIB[Kibana]
    end

    FW -->|OTLP| OTLP_R
    CS -->|OTLP| OTLP_R
    BS -->|OTLP| OTLP_R
    OTLP_R --> PROC
    PROM -->|scrapes /metrics :8889| PROC
    PROC -->|traces| TEMPO
    PROC -->|logs| LOKI
    PROC -->|traces + logs| ES
    TEMPO -->|blocks| MINIO
    LOKI -->|chunks + index| MINIO
    GRAF --> PROM
    GRAF --> TEMPO
    GRAF --> LOKI
    GRAF --> ES
    KIB --> ES

    style FW fill:#ffffff,stroke:#0f172a,stroke-width:1px,color:#0f172a,rx:6,ry:6
    style CS fill:#ffffff,stroke:#0f172a,stroke-width:1px,color:#0f172a,rx:6,ry:6
    style BS fill:#ffffff,stroke:#0f172a,stroke-width:1px,color:#0f172a,rx:6,ry:6
    style OTLP_R fill:#e6f4fb,stroke:#0284c7,stroke-width:1.2px,color:#0f172a,rx:6,ry:6
    style PROC fill:#f3f4f6,stroke:#475569,stroke-width:1px,color:#0f172a,rx:6,ry:6
    style PROM fill:#f3f4f6,stroke:#475569,stroke-width:1px,color:#0f172a,rx:6,ry:6
    style TEMPO fill:#f3f4f6,stroke:#475569,stroke-width:1px,color:#0f172a,rx:6,ry:6
    style LOKI fill:#f3f4f6,stroke:#475569,stroke-width:1px,color:#0f172a,rx:6,ry:6
    style GRAF fill:#e6f4fb,stroke:#0284c7,stroke-width:1px,color:#0f172a,rx:6,ry:6
    style MINIO fill:#f0f1f3,stroke:#475569,stroke-width:1px,color:#0f172a,rx:6,ry:6
    style ES fill:#f3f4f6,stroke:#475569,stroke-width:1px,color:#0f172a,rx:6,ry:6
    style KIB fill:#f3f4f6,stroke:#475569,stroke-width:1px,color:#0f172a,rx:6,ry:6
Every signal type is handled by the backend designed for it. Traces go to Tempo, logs to Loki, metrics to Prometheus — and all three are queried through a single pane of glass in Grafana. Tempo and Loki store their data in MinIO, an S3-compatible object store, so trace blocks and log chunks survive container restarts. The Elasticsearch exporter on the Collector also pushes traces and logs into Elasticsearch, where Kibana provides an alternative full-featured UI.
Prerequisites
- .NET 10 SDK (or later)
- Docker Desktop
- The observability-aspire-opentelemetry-dotnet repository cloned locally
- For the complete walkthrough, work from its
aspireshopdirectory. - For the minimal example, work from its
simple-api-otlpdirectory.
Part 1: Instrumenting the .NET Application
The Service Defaults Library
Aspire projects share instrumentation through a Service Defaults project. In the AspireShop solution, AspireShop.ServiceDefaults defines the AddServiceDefaults() extension that every service calls in its Program.cs:
Source: AspireShop.CatalogService/Program.cs
// AspireShop.CatalogService/Program.cs
var builder = WebApplication.CreateBuilder(args);

builder.AddServiceDefaults();  // <-- wires up OTel, health checks, service discovery
builder.AddNpgsqlDbContext<CatalogDbContext>("catalogdb");
// ...
The AddServiceDefaults method does three things: it configures OpenTelemetry, adds health checks, and enables service discovery with resilience. The OpenTelemetry setup lives in ConfigureOpenTelemetry:
Source: AspireShop.ServiceDefaults/Extensions.cs
// AspireShop.ServiceDefaults/Extensions.cs (excerpt)
public static IHostApplicationBuilder ConfigureOpenTelemetry(
    this IHostApplicationBuilder builder)
{
    builder.Logging.AddOpenTelemetry(logging =>
    {
        logging.IncludeFormattedMessage = true;
        logging.IncludeScopes = true;
    });

    builder.Services.AddOpenTelemetry()
        .WithMetrics(metrics =>
        {
            metrics
                .AddAspNetCoreInstrumentation()
                .AddHttpClientInstrumentation()
                .AddRuntimeInstrumentation();
        })
        .WithTracing(tracing =>
        {
            tracing
                .AddSource(builder.Environment.ApplicationName)
                .AddAspNetCoreInstrumentation(tracing =>
                    tracing.Filter = httpContext =>
                        !(httpContext.Request.Path.StartsWithSegments("/health")
                          || httpContext.Request.Path.StartsWithSegments("/alive")))
                .AddGrpcClientInstrumentation()
                .AddHttpClientInstrumentation();
        });

    builder.AddOpenTelemetryExporters();
    return builder;
}
The instrumentation covers the key signals:
- Metrics: ASP.NET Core request duration, HTTP client calls, and .NET runtime metrics (GC, heap, thread pool).
- Tracing: Inbound HTTP requests, outbound HTTP calls, and gRPC client calls. Health-check endpoints are filtered out to reduce noise.
- Logging:
ILoggerentries are bridged into the OTel pipeline, preserving formatted messages and scopes.
Exporting to the Collector
The OTLP exporter is wired in a separate private method. It checks for the OTEL_EXPORTER_OTLP_ENDPOINT environment variable — if set, it calls UseOtlpExporter():
Source: AspireShop.ServiceDefaults/Extensions.cs
// AspireShop.ServiceDefaults/Extensions.cs (excerpt)
private static IHostApplicationBuilder AddOpenTelemetryExporters(
    this IHostApplicationBuilder builder)
{
    var useOtlpExporter = !string.IsNullOrWhiteSpace(
        builder.Configuration["OTEL_EXPORTER_OTLP_ENDPOINT"]);

    if (useOtlpExporter)
    {
        builder.Services.AddOpenTelemetry().UseOtlpExporter();
    }

    return builder;
}
The UseOtlpExporter() call reads the standard OTel environment variables — OTEL_EXPORTER_OTLP_ENDPOINT and OTEL_EXPORTER_OTLP_PROTOCOL — so you never hardcode a collector address.
Default Aspire Injection vs Our Explicit Override
This distinction matters because Aspire already has a default telemetry path before we add a Collector.
When you run the application through the AppHost, Aspire automatically starts the Aspire Dashboard and configures the child services to export telemetry to the dashboard OTLP endpoint. In this sample, the AppHost launch profile declares that dashboard endpoint:
Source: AspireShop.AppHost/Properties/launchSettings.json
// AspireShop.AppHost/Properties/launchSettings.json (excerpt)
"environmentVariables": {
  "ASPNETCORE_ENVIRONMENT": "Development",
  "DOTNET_ENVIRONMENT": "Development",
  "ASPIRE_ALLOW_UNSECURED_TRANSPORT": "true",
  "ASPIRE_DASHBOARD_OTLP_ENDPOINT_URL": "https://localhost:16224",
  "ASPIRE_RESOURCE_SERVICE_ENDPOINT_URL": "https://localhost:22123"
}
In that default Aspire mode, the effective flow is:
service -> Aspire Dashboard
Our AppHost.cs adds an override hook on top of that default behavior. It only forwards OTEL_EXPORTER_OTLP_ENDPOINT and OTEL_EXPORTER_OTLP_PROTOCOL when those variables are already present in the parent environment:
Source: AspireShop.AppHost/AppHost.cs
// AspireShop.AppHost/AppHost.cs (excerpt)
var otlpEndpoint = Environment.GetEnvironmentVariable("OTEL_EXPORTER_OTLP_ENDPOINT");
var otlpProtocol = Environment.GetEnvironmentVariable("OTEL_EXPORTER_OTLP_PROTOCOL");

if (!string.IsNullOrWhiteSpace(otlpEndpoint))
{
  catalogService.WithEnvironment("OTEL_EXPORTER_OTLP_ENDPOINT", otlpEndpoint);

  if (!string.IsNullOrWhiteSpace(otlpProtocol))
  {
    catalogService.WithEnvironment("OTEL_EXPORTER_OTLP_PROTOCOL", otlpProtocol);
  }
}
That override is what lets this sample switch from the default Aspire behavior to a Collector-routed topology without changing service code.
Fallback for Standalone Runs
When you run a service outside the AppHost (for example, during development with dotnet run), the OTLP variables come from launchSettings.json:
Source: AspireShop.CatalogService/Properties/launchSettings.json
// AspireShop.CatalogService/Properties/launchSettings.json (excerpt)
"environmentVariables": {
  "ASPNETCORE_ENVIRONMENT": "Development",
  "ASPIRE_ALLOW_UNSECURED_TRANSPORT": "true",
  "OTEL_EXPORTER_OTLP_ENDPOINT": "http://localhost:4317"
}
The ASPIRE_ALLOW_UNSECURED_TRANSPORT flag is important: in local development the Collector runs without TLS, and Aspire needs explicit permission to skip it.
Running Services Standalone
There are two ways to start the services. When you run through the AppHost (dotnet run --project AspireShop.AppHost), the host injects OTEL_EXPORTER_OTLP_ENDPOINT into every project. But you can also run individual services directly — for example, when debugging the BasketService in isolation:
dotnet run --project AspireShop.BasketService --launch-profile httpsThis works because every service's launchSettings.json has the same OTEL_EXPORTER_OTLP_ENDPOINT variable. Even without the AppHost, the service resolves the endpoint from launchSettings.json and starts pushing telemetry to the Collector on localhost:4317. The same is true for CatalogService, CatalogDbManager, and Frontend — all four projects share the identical OTLP configuration in their launch profiles.
This dual-path design means you get consistent observability whether you run the full distributed app via the AppHost or spin up a single service for focused debugging.
What Changes When the OTLP Endpoint Targets the Collector
If OTEL_EXPORTER_OTLP_ENDPOINT points to the Collector, each service sends telemetry only once, and that first hop is the Collector:
service -> Collector
The Collector then fans telemetry out to multiple destinations:
- traces -> Tempo, Aspire Dashboard, and Elasticsearch
- metrics -> Prometheus and Aspire Dashboard
- logs -> Loki, Aspire Dashboard, and Elasticsearch
This is not a double export from the service process. The service is not sending one copy to the dashboard and another copy to the Collector. The duplication happens inside the Collector pipelines, which is exactly what a Collector is designed to do.
The Aspire Dashboard: A Second Pane of Glass
While this article focuses on the external LGTM stack, the .NET Aspire Dashboard is also receiving telemetry. Look at the Collector's otlp/aspire exporter in the pipeline config:
otlp/aspire:
  endpoint: '${env:ASPIRE_OTLP_ENDPOINT}'
  headers:
    x-otlp-api-key: '${env:ASPIRE_API_KEY}'
  tls:
    insecure: ${env:ASPIRE_INSECURE}
    insecure_skip_verify: true
This exporter fans out all three signals (traces, metrics, and logs) to the Aspire Dashboard — a built-in developer UI that starts alongside the AppHost. The Collector acts as a telemetry fork: one copy goes to the LGTM stack (Prometheus/Tempo/Loki), another copy goes to the Aspire Dashboard for quick local inspection during development.
One detail is easy to miss: the Aspire Dashboard is not running as a Docker Compose service in this sample. It is started by the AppHost on the host machine. The Collector container reaches it through host.docker.internal, which is why the Compose file sets ASPIRE_OTLP_ENDPOINT to the host's dashboard OTLP address.
%%{init: {
  'theme': 'base',
  'themeVariables': {
    'background': '#fafaf7',
    'primaryColor': '#ffffff',
    'primaryTextColor': '#0f172a',
    'primaryBorderColor': '#cbd5e1',
    'lineColor': '#475569',
    'secondaryColor': '#f3f4f6',
    'tertiaryColor': '#f3f4f6',
    'fontFamily': 'Geist, ui-sans-serif, sans-serif',
    'fontSize': '14px',
    'edgeLabelBackground': '#fafaf7',
    'nodeBorder': '2px',
    'mainBkg': '#fafaf7',
    'nodePadding': '12px'
  }
}}%%
graph LR
    APP[.NET Services]
    COL[OTel Collector]
    LGTM[LGTM Stack<br/>Grafana]
    ASP[Aspire Dashboard<br/>Dev UI]

    APP -->|OTLP| COL
    COL -->|traces, metrics & logs| LGTM
    COL -->|traces, metrics & logs| ASP

    style APP fill:#ffffff,stroke:#0f172a,stroke-width:1px,color:#0f172a,rx:6,ry:6
    style COL fill:#e6f4fb,stroke:#0284c7,stroke-width:1.2px,color:#0f172a,rx:6,ry:6
    style LGTM fill:#f3f4f6,stroke:#475569,stroke-width:1px,color:#0f172a,rx:6,ry:6
    style ASP fill:#e6f4fb,stroke:#0284c7,stroke-width:1px,color:#0f172a,rx:6,ry:6
The Aspire Dashboard gives you structured logs, trace waterfalls, and metrics charts without opening Grafana — useful during active development. The external Grafana stack is for deeper analysis, historical queries, alerting, and team-wide dashboards. Both consume the same telemetry; you choose which pane of glass fits the moment.
Two Paths to the Dashboard: Direct vs Collector-Routed
There are two ways to get telemetry into the Aspire Dashboard, and understanding the difference matters.
Path A: Direct AppHost → Dashboard (Default Aspire Pattern)
The AppHost's own launchSettings.json configures how the AppHost communicates with the dashboard it spawns. The official Aspire sample uses these variables:
// AspireShop.AppHost/Properties/launchSettings.json
"environmentVariables": {
  "ASPNETCORE_ENVIRONMENT": "Development",
  "DOTNET_ENVIRONMENT": "Development",
  "ASPIRE_DASHBOARD_OTLP_ENDPOINT_URL": "https://localhost:16224",
  "ASPIRE_RESOURCE_SERVICE_ENDPOINT_URL": "https://localhost:22123"
}| Variable | Default | Purpose |
|---|---|---|
ASPIRE_DASHBOARD_OTLP_ENDPOINT_URL | http://localhost:18889 | OTLP/gRPC endpoint where the dashboard listens for telemetry |
ASPIRE_RESOURCE_SERVICE_ENDPOINT_URL | null | gRPC endpoint the dashboard connects to for the resource list and console logs |
In the default Aspire pattern, the AppHost injects OTEL_EXPORTER_OTLP_ENDPOINT into child services pointing to this same dashboard OTLP endpoint. The result: every service sends telemetry directly to the Aspire Dashboard — no Collector in the path.
%%{init: {
  'theme': 'base',
  'themeVariables': {
    'background': '#fafaf7',
    'primaryColor': '#ffffff',
    'primaryTextColor': '#0f172a',
    'primaryBorderColor': '#cbd5e1',
    'lineColor': '#475569',
    'secondaryColor': '#f3f4f6',
    'tertiaryColor': '#f3f4f6',
    'fontFamily': 'Geist, ui-sans-serif, sans-serif',
    'fontSize': '14px',
    'edgeLabelBackground': '#fafaf7',
    'nodeBorder': '2px',
    'mainBkg': '#fafaf7',
    'nodePadding': '12px'
  }
}}%%
graph LR
    subgraph "Default Aspire Pattern"
        direction LR
        APP[AppHost]
        DASH[Aspire Dashboard<br/>OTLP :18889]
        SVC1[Service A]
        SVC2[Service B]

        APP -->|spawns| DASH
        SVC1 -->|OTLP| DASH
        SVC2 -->|OTLP| DASH
    end

    style APP fill:#f3f4f6,stroke:#475569,stroke-width:1px,color:#0f172a,rx:6,ry:6
    style DASH fill:#e6f4fb,stroke:#0284c7,stroke-width:1.2px,color:#0f172a,rx:6,ry:6
    style SVC1 fill:#ffffff,stroke:#0f172a,stroke-width:1px,color:#0f172a,rx:6,ry:6
    style SVC2 fill:#ffffff,stroke:#0f172a,stroke-width:1px,color:#0f172a,rx:6,ry:6
This is perfect for local development when all you need is the built-in dashboard. Zero infrastructure beyond the AppHost itself.
For this sample's Docker Compose integration, the default Collector target is the AppHost's HTTP dashboard endpoint at http://host.docker.internal:16223 with ASPIRE_INSECURE=true. If you switch the AppHost to its HTTPS profile, override the Collector to https://host.docker.internal:16224 and set ASPIRE_INSECURE=false while keeping certificate verification skipped for local development.
During development, open the Dashboard URL printed by Aspire and generate a few requests against the frontend. The following screenshots show the three core telemetry views produced by the direct service-to-dashboard path.
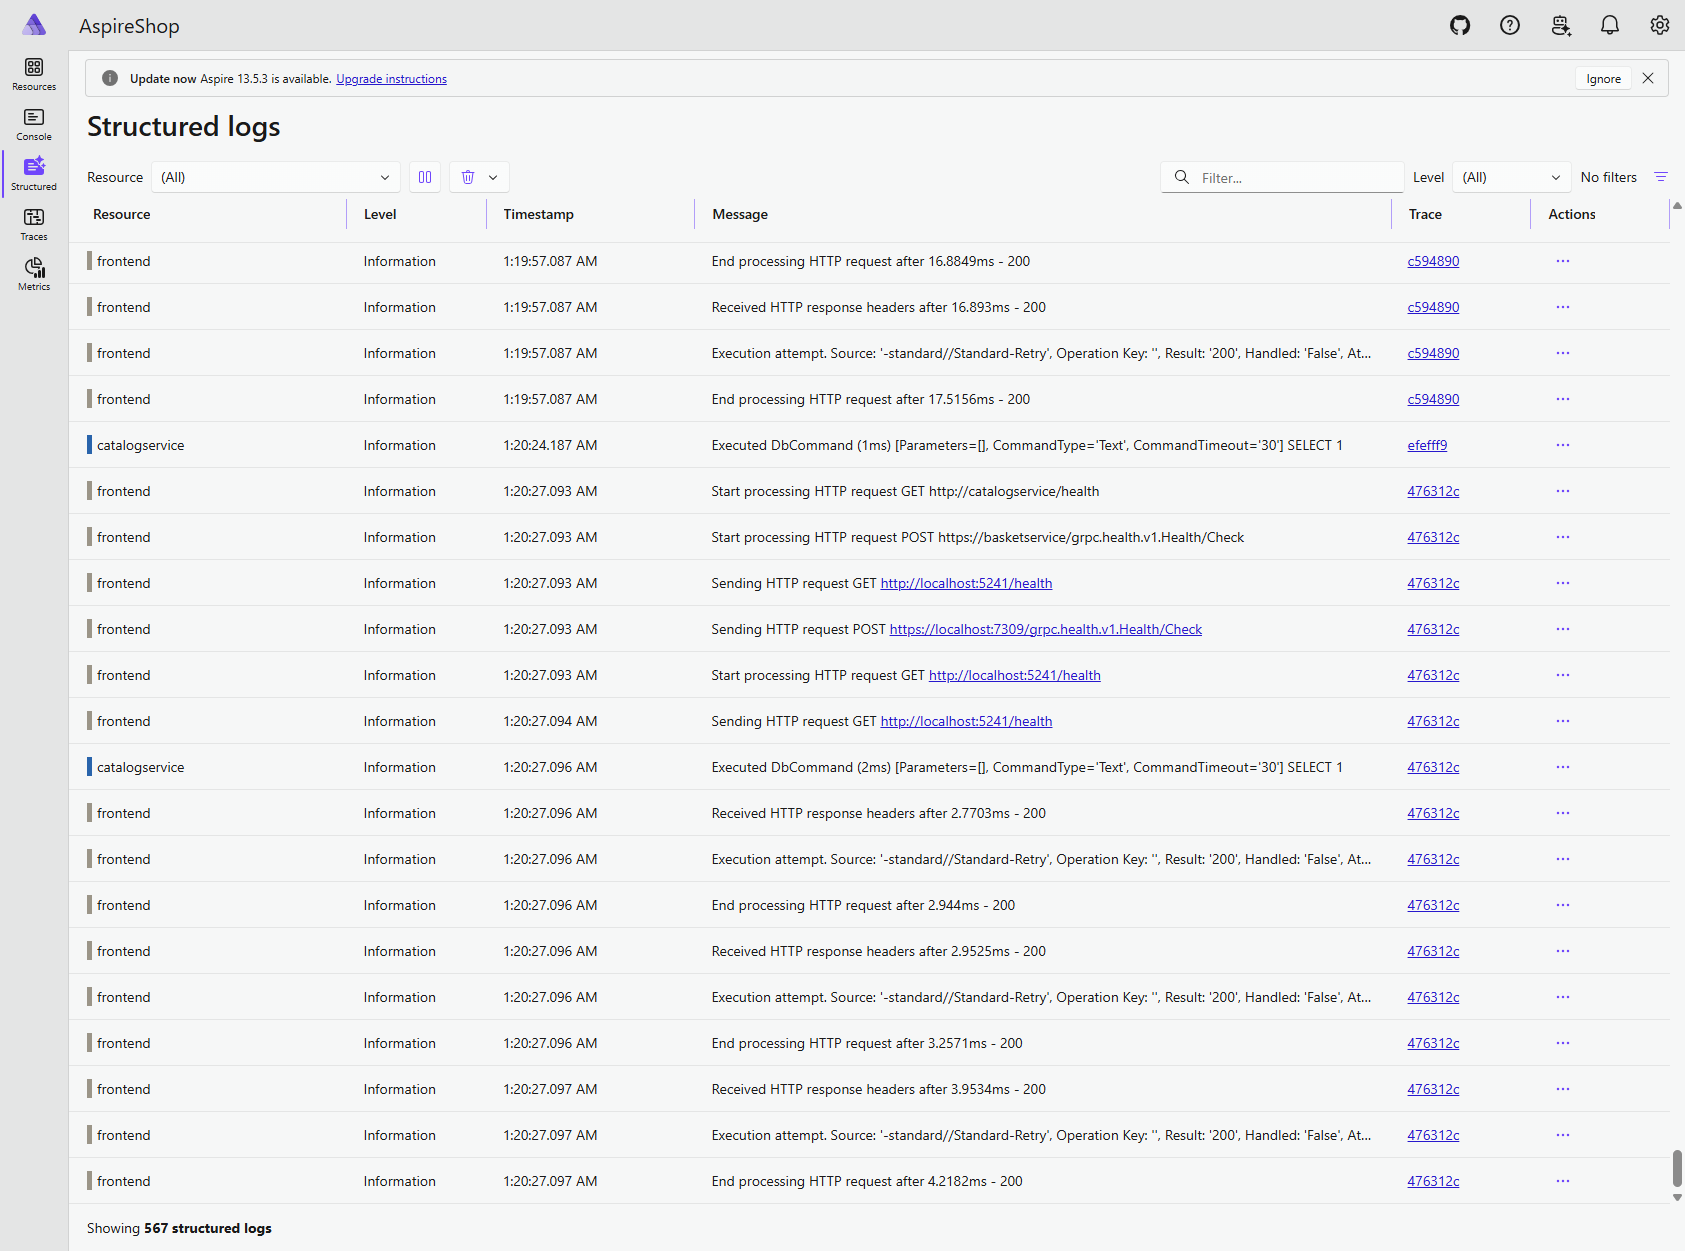
The Structured logs view presents structured application events with resource, severity, timestamp, message, and trace links. Selecting a trace link moves from an individual log entry to its distributed request.
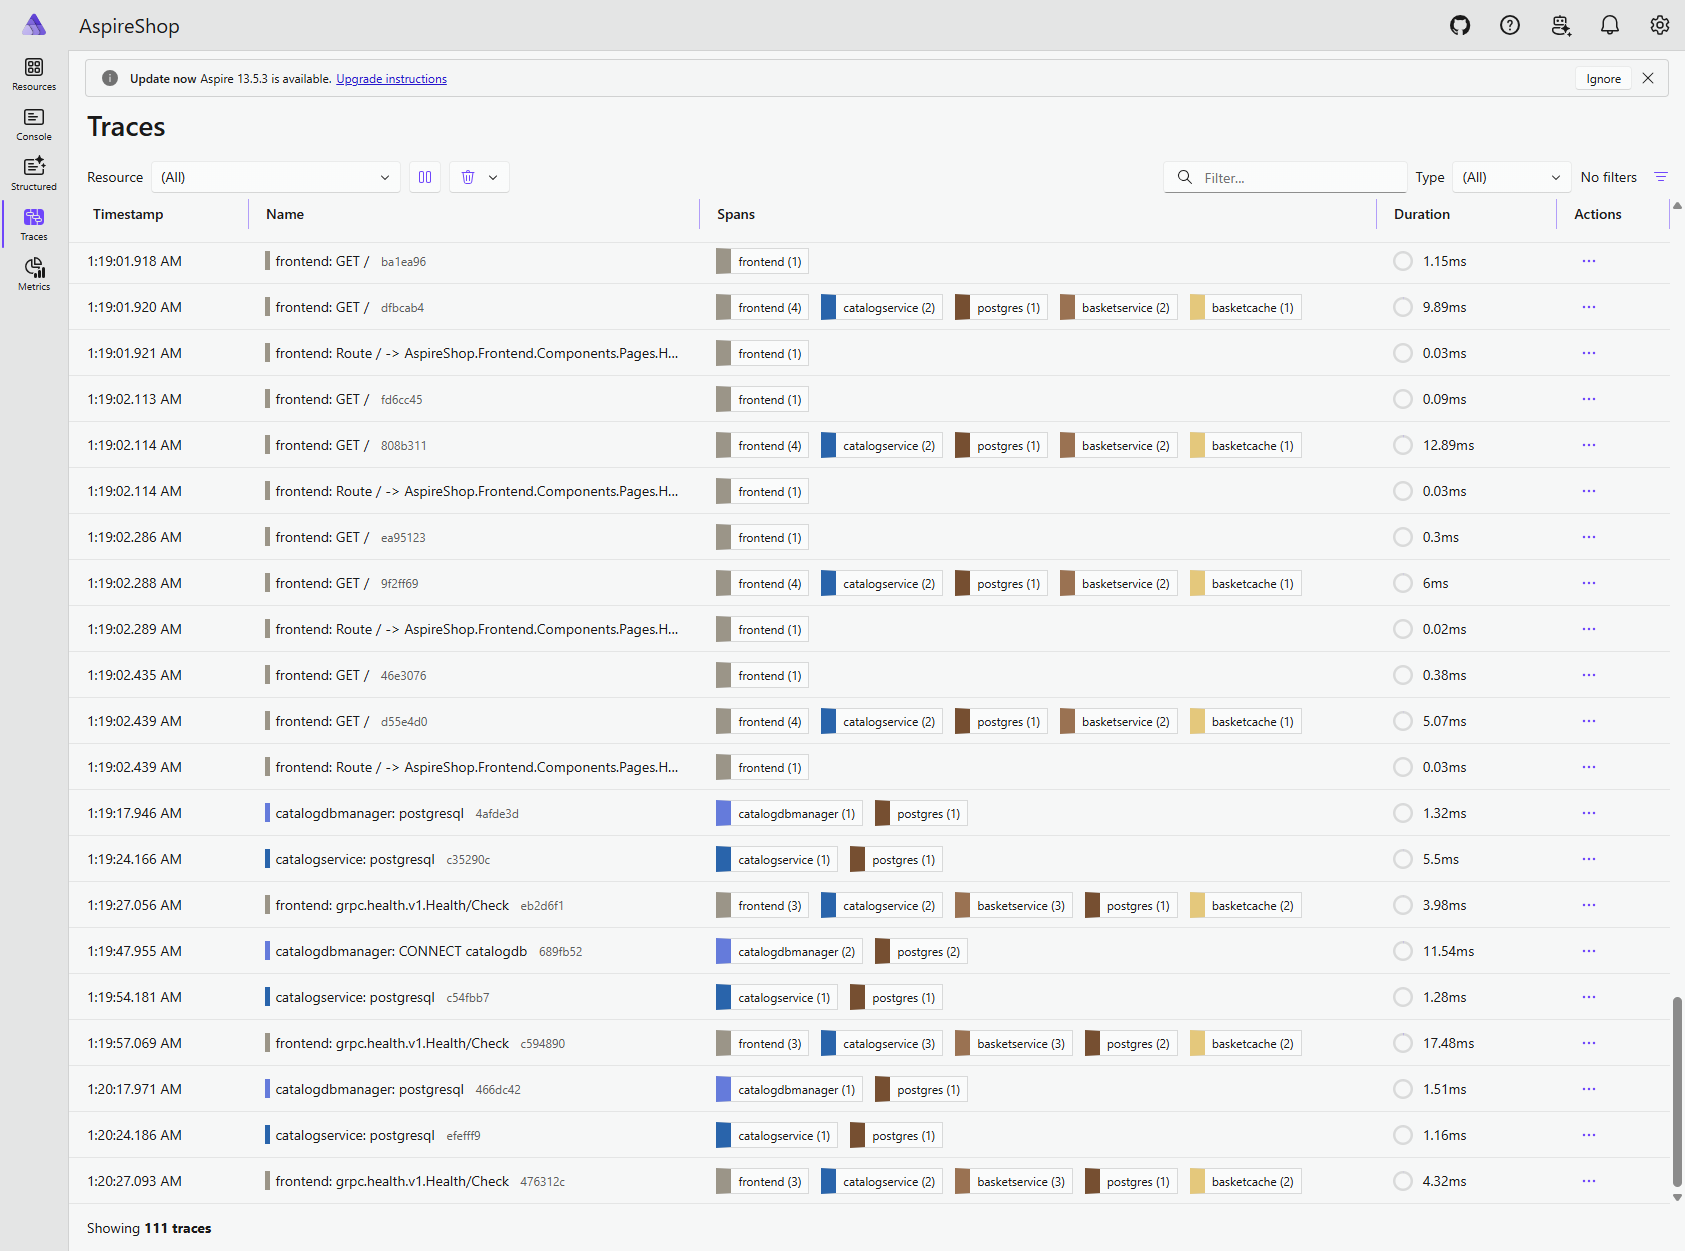
The Traces view groups spans into distributed operations. In this run, a request can be followed across the frontend, catalog service, basket service, PostgreSQL, and Redis resources.
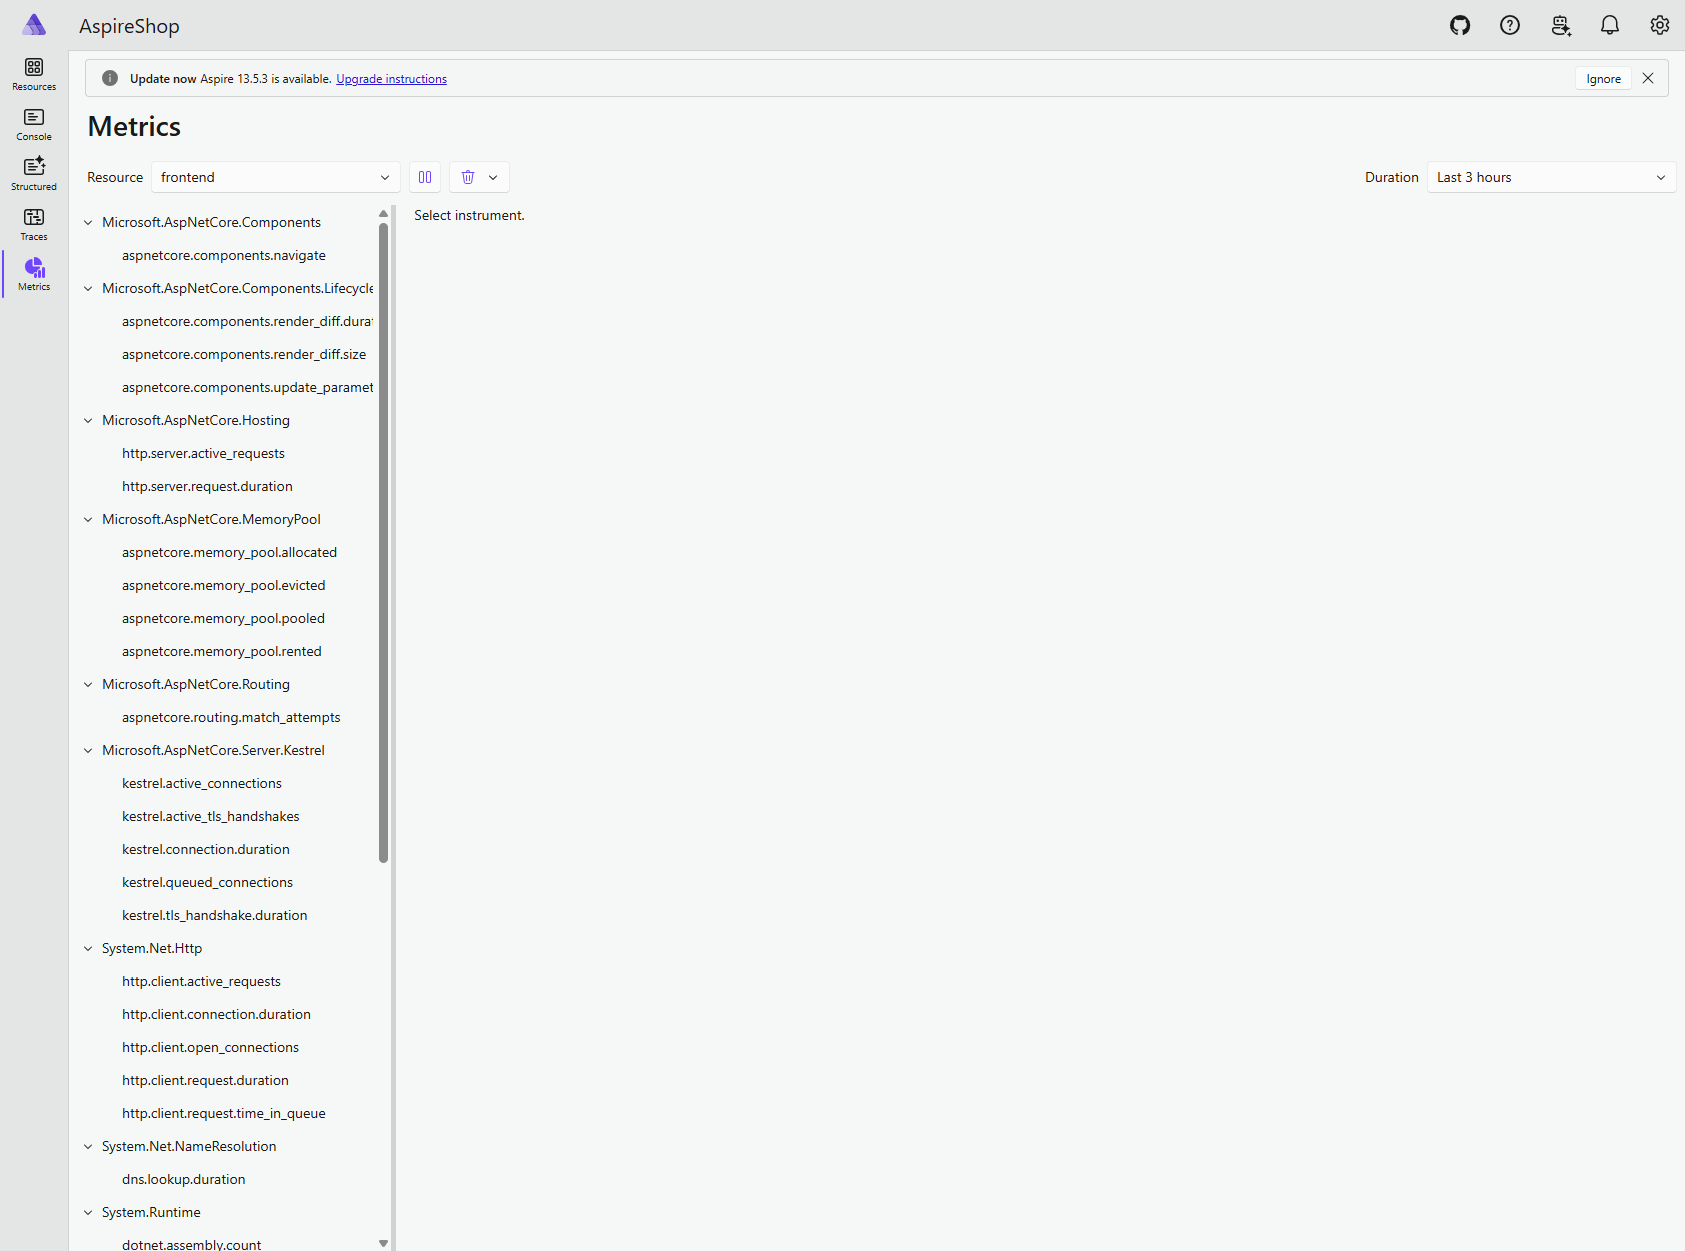
The Metrics view is resource-scoped. Select a resource such as frontend to browse its instrument groups, including ASP.NET Core request, routing, memory-pool, and Blazor component measurements.
Path B: Collector-Routed (Our Setup)
In this article we reroute telemetry through the OTel Collector. Our AppHost's launchSettings.json sets both variables side by side:
// AspireShop.AppHost/Properties/launchSettings.json
"environmentVariables": {
  "ASPIRE_ALLOW_UNSECURED_TRANSPORT": "true",
  "ASPIRE_DASHBOARD_OTLP_ENDPOINT_URL": "https://localhost:16224",
  "ASPIRE_RESOURCE_SERVICE_ENDPOINT_URL": "https://localhost:22123",
  "OTEL_EXPORTER_OTLP_ENDPOINT": "http://localhost:4317"
}
ASPIRE_DASHBOARD_OTLP_ENDPOINT_URL tells the AppHost where the dashboard listens. OTEL_EXPORTER_OTLP_ENDPOINT, set to localhost:4317, tells the AppHost (and every child service) to send telemetry to the Collector instead of directly to the dashboard. The Collector then fans out to both the dashboard and the LGTM stack:
%%{init: {
  'theme': 'base',
  'themeVariables': {
    'background': '#fafaf7',
    'primaryColor': '#ffffff',
    'primaryTextColor': '#0f172a',
    'primaryBorderColor': '#cbd5e1',
    'lineColor': '#475569',
    'secondaryColor': '#f3f4f6',
    'tertiaryColor': '#f3f4f6',
    'fontFamily': 'Geist, ui-sans-serif, sans-serif',
    'fontSize': '14px',
    'edgeLabelBackground': '#fafaf7',
    'nodeBorder': '2px',
    'mainBkg': '#fafaf7',
    'nodePadding': '12px'
  }
}}%%
graph LR
    subgraph "Collector-Routed Pattern"
        direction LR
        SVC1[Service A]
        SVC2[Service B]
        COL[OTel Collector<br/>:4317]
        DASH2[Aspire Dashboard]
        PROM[Prometheus]
        TEMPO[Tempo]
        LOKI[Loki]

        SVC1 -->|OTLP| COL
        SVC2 -->|OTLP| COL
        COL -->|otlp/aspire| DASH2
        PROM -->|scrapes /metrics :8889| COL
        COL -->|otlp/tempo| TEMPO
        COL -->|otlphttp/loki| LOKI
    end

    style SVC1 fill:#ffffff,stroke:#0f172a,stroke-width:1px,color:#0f172a,rx:6,ry:6
    style SVC2 fill:#ffffff,stroke:#0f172a,stroke-width:1px,color:#0f172a,rx:6,ry:6
    style COL fill:#e6f4fb,stroke:#0284c7,stroke-width:1.2px,color:#0f172a,rx:6,ry:6
    style DASH2 fill:#e6f4fb,stroke:#0284c7,stroke-width:1px,color:#0f172a,rx:6,ry:6
    style PROM fill:#f3f4f6,stroke:#475569,stroke-width:1px,color:#0f172a,rx:6,ry:6
    style TEMPO fill:#f3f4f6,stroke:#475569,stroke-width:1px,color:#0f172a,rx:6,ry:6
    style LOKI fill:#f3f4f6,stroke:#475569,stroke-width:1px,color:#0f172a,rx:6,ry:6
The AppHost's launchSettings.json still has ASPIRE_DASHBOARD_OTLP_ENDPOINT_URL — that configures where the dashboard listens. But the AppHost code overrides OTEL_EXPORTER_OTLP_ENDPOINT to point to the Collector, not the dashboard.
When to Use Each
| Scenario | Use |
|---|---|
| Local dev, only need the built-in dashboard | Path A — default Aspire. No extra infrastructure. |
| Need external backends (Grafana, Prometheus, Tempo) | Path B — route through Collector. One telemetry stream, multiple destinations. |
| Production or staging with centralized observability | Path B — Collector gives you batching, filtering, and multi-backend export. |
| Debugging a single service in isolation | Either — launchSettings fallback works for both paths. |
The two paths are not mutually exclusive. The AppHost always sends its own infrastructure telemetry (resource lifecycle events, startup logs) to the dashboard via ASPIRE_DASHBOARD_OTLP_ENDPOINT_URL. Path B only changes where service-level telemetry goes first — it still ends up at the dashboard, just through the Collector.
No separate dashboard container. The Aspire Dashboard is not defined in
docker-compose.yaml. The AppHost launches it as a child process automatically when you rundotnet run. The Collector (running in Docker) reaches it athost.docker.internal:16224via theASPIRE_OTLP_ENDPOINTenv var. There is nothing extra to containerize — it just works.
At this point the .NET side is done. Every service emits OTLP over gRPC to localhost:4317, and the Collector fans it to both the Aspire Dashboard and the external observability stack. Next we build the infrastructure that receives it.
Part 2: The Docker Compose Infrastructure Stack
The observability infrastructure is defined in the Docker Compose file. Aspire owns the application graph and its development dependencies (postgres, catalogdb, basketcache, and the .NET projects); Compose owns the telemetry backends and supporting infrastructure.
| Service | Image | Port(s) | Role |
|---|---|---|---|
minio | minio/minio:latest | 9000, 9001 | S3 storage for Loki & Tempo |
minio-bucket-creator | minio/mc:latest | — | Creates loki & tempo buckets |
otel-collector | otel/opentelemetry-collector-contrib:latest | 4317, 4318, 8888, 8889, 13133 | Telemetry pipeline |
prometheus | prom/prometheus:latest | 9090 | Metrics store |
tempo | grafana/tempo:latest | 3200, 4317* | Trace store |
loki | grafana/loki:latest | 3100 | Log store |
grafana | grafana/grafana:latest | 3000 | Dashboards |
grafana-dashboard-importer | python:3.13-alpine | — | Imports dashboards via Grafana API |
node-exporter | prom/node-exporter:latest | 9100 | Host metrics |
cadvisor | gcr.io/cadvisor/cadvisor:latest | 8080 | Container metrics |
elasticsearch | docker.elastic.co/elasticsearch/elasticsearch:8.15.2 | 9200, 9300 | Optional log/trace store |
kibana | docker.elastic.co/kibana/kibana:8.15.2 | 5601 | Optional ELK UI |
All Docker Compose service snippets
The following excerpt contains the complete service definitions first. Container responsibilities follow in the table below. Full configuration, including networks, environment variables, volumes, and health dependencies, is available in the Docker Compose file.
name: aspire-shop-infrastructure
services:
  #######################################################
  #  Observability: OpenTelemetry Collector
  #######################################################
  otel-collector:
    image: otel/opentelemetry-collector-contrib:latest
    restart: unless-stopped
    command: ['--config=/etc/otelcol-contrib/config.yaml']
    environment:
      - ASPIRE_OTLP_ENDPOINT=${ASPIRE_OTLP_ENDPOINT:-host.docker.internal:16224}
      - ASPIRE_API_KEY=${ASPIRE_API_KEY:-}
      - ASPIRE_INSECURE=false
      - PROMETHEUS_ENDPOINT=http://prometheus:9090/api/v1/otlp
      - LOKI_ENDPOINT=http://loki:3100/otlp
      - TEMPO_URL=tempo:4317
      - ELASTICSEARCH_ENDPOINT=http://elasticsearch:9200
    volumes:
      - ./../configs/otel-collector-config.yaml:/etc/otelcol-contrib/config.yaml
    ports:
      - '4317:4317' # OTLP gRPC ingest from apps and services
      - '4318:4318' # OTLP HTTP ingest from apps and services
      - '8888:8888' # Collector self-telemetry metrics endpoint
      - '8889:8889' # Reserved observability endpoint for additional collector exporters
      - '13133:13133' # Collector health check endpoint
    networks:
      - infrastructure

  #######################################################
  #  Observability: Metrics (Prometheus)
  #######################################################
  prometheus:
    image: prom/prometheus:latest
    restart: unless-stopped
    ports:
      - '9090:9090' # Prometheus UI and query API
    volumes:
      - ./../configs/prometheus.yaml:/etc/prometheus/prometheus.yml
    command:
      - '--config.file=/etc/prometheus/prometheus.yml'
      - '--storage.tsdb.path=/prometheus'
      - '--web.enable-otlp-receiver'
      - '--enable-feature=native-histograms'
      - '--log.level=info'
    networks:
      - infrastructure

  node-exporter:
    image: prom/node-exporter:latest
    platform: linux/amd64
    restart: unless-stopped
    volumes:
      - /proc:/host/proc:ro
      - /sys:/host/sys:ro
      - /:/rootfs:ro
    command:
      - '--path.procfs=/host/proc'
      - '--path.rootfs=/rootfs'
      - '--path.sysfs=/host/sys'
    ports:
      - '9100:9100' # Node exporter metrics endpoint
    networks:
      - infrastructure

  cadvisor:
    image: gcr.io/cadvisor/cadvisor:latest
    platform: linux/amd64
    restart: unless-stopped
    privileged: true
    volumes:
      - /:/rootfs:ro
      - /var/run:/var/run:ro
      - /sys:/sys:ro
      - /var/lib/docker:/var/lib/docker:ro
      - /dev/disk:/dev/disk:ro
    ports:
      - '8080:8080' # cAdvisor metrics and UI endpoint
    networks:
      - infrastructure

  #######################################################
  #  Observability: S3-Compatible Storage (MinIO)
  #######################################################
  minio:
    image: minio/minio:latest
    restart: unless-stopped
    command:
      - server
      - /data
      - --console-address
      - :9001
    environment:
      MINIO_ROOT_USER: ${MINIO_USER:-minioadmin}
      MINIO_ROOT_PASSWORD: ${MINIO_PASSWORD:-minioadmin}
      MINIO_PROMETHEUS_AUTH_TYPE: public
    ports:
      - '9000:9000' # MinIO S3 API
      - '9001:9001' # MinIO Console UI
    volumes:
      - minio_data:/data
    networks:
      - infrastructure

  minio-bucket-creator:
    image: minio/mc:latest
    restart: on-failure
    entrypoint:
      - /bin/sh
    command:
      - -c
      - |
        /usr/bin/mc alias set myminio http://minio:9000 $${MINIO_USER} $${MINIO_PASSWORD}
        /usr/bin/mc mb myminio/loki --ignore-existing
        /usr/bin/mc anonymous set public myminio/loki
        /usr/bin/mc mb myminio/tempo --ignore-existing
        /usr/bin/mc anonymous set public myminio/tempo
        exit 0
    environment:
      MINIO_USER: ${MINIO_USER:-minioadmin}
      MINIO_PASSWORD: ${MINIO_PASSWORD:-minioadmin}
    depends_on:
      minio:
        condition: service_started
    networks:
      - infrastructure

  #######################################################
  #  Observability: Traces & Logs (Grafana Stack)
  #######################################################
  tempo:
    image: grafana/tempo:latest
    restart: unless-stopped
    command: ['-config.file=/etc/tempo.yaml', '-config.expand-env=true']
    environment:
      - MINIO_USER=${MINIO_USER:-minioadmin}
      - MINIO_PASSWORD=${MINIO_PASSWORD:-minioadmin}
    volumes:
      - ./../configs/tempo.yaml:/etc/tempo.yaml
    expose:
      - '3200' # Tempo query API for Grafana
      - '4317' # Tempo OTLP gRPC ingest from collector
    depends_on:
      minio-bucket-creator:
        condition: service_completed_successfully
    networks:
      - infrastructure

  loki:
    image: grafana/loki:latest
    restart: unless-stopped
    command: -config.file=/etc/loki/local-config.yaml -config.expand-env=true
    environment:
      - MINIO_USER=${MINIO_USER:-minioadmin}
      - MINIO_PASSWORD=${MINIO_PASSWORD:-minioadmin}
    volumes:
      - ./../configs/loki-config.yaml:/etc/loki/local-config.yaml
    expose:
      - '3100' # Loki HTTP API for Grafana and OTLP log ingestion
    depends_on:
      minio-bucket-creator:
        condition: service_completed_successfully
    networks:
      - infrastructure

  grafana:
    image: grafana/grafana:latest
    platform: linux/amd64
    restart: unless-stopped
    environment:
      - GF_SECURITY_ADMIN_USER=admin
      - GF_SECURITY_ADMIN_PASSWORD=admin
      - GF_FEATURE_TOGGLES_ENABLE=traceqlEditor
    depends_on:
      - prometheus
      - tempo
      - loki
      - elasticsearch
    ports:
      - '3000:3000' # Grafana UI
    volumes:
      - ./../configs/grafana/provisioning:/etc/grafana/provisioning
      - ./../configs/grafana/dashboards:/var/lib/grafana/dashboards-imported
    networks:
      - infrastructure

  grafana-dashboard-importer:
    image: python:3.13-alpine
    restart: on-failure
    environment:
      GF_SECURITY_ADMIN_USER: admin
      GF_SECURITY_ADMIN_PASSWORD: admin
      GRAFANA_URL: http://grafana:3000
    volumes:
      - ./import-dashboards.py:/import-dashboards.py:ro
      - ./../configs/grafana/dashboards-source:/dashboards:ro
    command: ['python', '/import-dashboards.py']
    depends_on:
      grafana:
        condition: service_started
    networks:
      - infrastructure

  #######################################################
  #  Observability: ELK Stack (Elasticsearch & Kibana)
  #######################################################
  elasticsearch:
    image: docker.elastic.co/elasticsearch/elasticsearch:8.15.2
    restart: unless-stopped
    environment:
      - discovery.type=single-node
      - cluster.name=docker-cluster
      - node.name=docker-node
      - 'ES_JAVA_OPTS=-Xms512m -Xmx512m'
      - xpack.security.enabled=false
      - xpack.security.http.ssl.enabled=false
      - xpack.security.transport.ssl.enabled=false
      - network.host=0.0.0.0
      - http.port=9200
      - bootstrap.memory_lock=true
      - cluster.routing.allocation.disk.threshold_enabled=false
    ulimits:
      memlock:
        soft: -1
        hard: -1
    ports:
      - '9200:9200' # Elasticsearch REST API
      - '9300:9300' # Elasticsearch transport port
    volumes:
      - elasticsearch_data:/usr/share/elasticsearch/data
    networks:
      - infrastructure

  kibana:
    image: docker.elastic.co/kibana/kibana:8.15.2
    restart: unless-stopped
    environment:
      - ELASTICSEARCH_HOSTS=http://elasticsearch:9200
    ports:
      - '5601:5601' # Kibana UI
    depends_on:
      - elasticsearch
    networks:
      - infrastructure

networks:
  infrastructure:
    name: infrastructure
    driver: bridge

volumes:
  minio_data:
  elasticsearch_data:
Container responsibilities
| Container | Responsibility |
|---|---|
otel-collector | Receives OTLP telemetry and routes metrics, traces, and logs to the configured backends. |
prometheus | Scrapes and stores metrics, then makes them available through PromQL. |
tempo | Stores traces in MinIO and serves trace queries to Grafana. |
loki | Stores OTLP logs and serves log queries to Grafana. |
grafana | Provides dashboards and Explore views for all configured data sources. |
minio | Provides S3-compatible object storage for Loki and Tempo. |
minio-bucket-creator | Creates the loki and tempo buckets before those backends start. |
node-exporter | Exports CPU, memory, disk, and network metrics from the Docker host. |
cadvisor | Exports per-container CPU, memory, filesystem, network, and throttling metrics. |
grafana-dashboard-importer | Imports dashboard JSON files through the Grafana API. |
elasticsearch | Optionally stores OTel-native logs and traces for Elastic queries. |
kibana | Provides the Elasticsearch and Elastic APM user interface. |
PostgreSQL and Redis are deliberately absent from this file. Aspire creates and wires those application dependencies, while Docker Compose supplies the observability infrastructure around them.
Monitoring Docker containers and host resources
Application telemetry answers questions about the application: how long requests take, which dependency calls fail, and how much work the .NET runtime is doing. It does not, by itself, explain whether a container is being throttled, whether the host is running out of memory, or whether a disk is filling up.
That is why this stack uses both cAdvisor and Node Exporter. They observe different layers:
| Component | Observes | Questions it helps answer |
|---|---|---|
| cAdvisor | Docker container resources and lifecycle | Which container is consuming CPU or memory? Is a container being throttled? Which container is using disk or network bandwidth? |
| Node Exporter | Host operating-system resources | How much CPU, memory, disk, and network capacity does the host have? Is the host itself under pressure? |
| Prometheus | Scraped time series from all targets | What changed over time, and can we alert on it? |
| Grafana | Queries and dashboards | How do we compare application, container, and host behavior in one view? |
The two exporters complement each other rather than duplicate each other. cAdvisor reports usage from the container perspective, while Node Exporter reports capacity and pressure from the host perspective. A container can appear healthy at the request level while consuming most of the host's memory, and a host can have spare capacity while one container is throttled by its own CPU limit. Looking at both layers makes those cases visible.
graph LR
    APP[.NET services] -->|OTLP metrics| COL[OpenTelemetry Collector]
    COL -->|exposes :8889/metrics| PROM[Prometheus]
    CAD[cAdvisor<br/>container metrics] -->|scrape :8080| PROM
    NODE[Node Exporter<br/>host metrics] -->|scrape :9100| PROM
    PROM --> GRAF[Grafana]

    style APP fill:#ffffff,stroke:#0f172a,stroke-width:1px,color:#0f172a,rx:6,ry:6
    style COL fill:#e6f4fb,stroke:#0284c7,stroke-width:1.2px,color:#0f172a,rx:6,ry:6
    style CAD fill:#f3f4f6,stroke:#475569,stroke-width:1px,color:#0f172a,rx:6,ry:6
    style NODE fill:#f3f4f6,stroke:#475569,stroke-width:1px,color:#0f172a,rx:6,ry:6
    style PROM fill:#f3f4f6,stroke:#475569,stroke-width:1px,color:#0f172a,rx:6,ry:6
    style GRAF fill:#e6f4fb,stroke:#0284c7,stroke-width:1px,color:#0f172a,rx:6,ry:6
cAdvisor: container-level visibility
cAdvisor reads container runtime and kernel data, then exposes Prometheus metrics such as container_cpu_usage_seconds_total, container_memory_working_set_bytes, container_fs_usage_bytes, and container_network_receive_bytes_total. These metrics let dashboards break resource usage down by container instead of showing only the aggregate host value.
The Compose service mounts the host paths cAdvisor needs to inspect Docker containers and their resource statistics:
Source: deployments/docker-compose/docker-compose.yaml
cadvisor:
  image: gcr.io/cadvisor/cadvisor:latest
  platform: linux/amd64
  restart: unless-stopped
  privileged: true
  volumes:
    - /:/rootfs:ro
    - /var/run:/var/run:ro
    - /sys:/sys:ro
    - /var/lib/docker:/var/lib/docker:ro
    - /dev/disk:/dev/disk:ro
  ports:
    - '8080:8080' # cAdvisor metrics and UI endpoint
The read-only mounts give cAdvisor visibility into the host filesystem, Docker runtime state, kernel statistics, and device information. privileged: true broadens that access so cAdvisor can collect container metrics in this local Docker deployment. It also increases the container's permissions, so production deployments should review the security requirements and use the smallest set of mounts and capabilities that their environment supports.
Prometheus discovers cAdvisor through the Docker Compose service name. The integration label is added during ingestion so dashboards can select container metrics without depending on a particular container IP address:
Source: deployments/configs/prometheus.yaml
- job_name: 'cadvisor'
  static_configs:
    - targets: ['cadvisor:8080']
  metric_relabel_configs:
    - target_label: integration
      replacement: container-metrics
For example, a Grafana panel can show container memory usage with a query like this:
sum by (name) (container_memory_working_set_bytes{integration="container-metrics", name!=""})Node Exporter: host-level visibility
Node Exporter exposes operating-system metrics for the machine running Docker. Typical series include node_cpu_seconds_total, node_memory_MemAvailable_bytes, node_filesystem_avail_bytes, and node_network_receive_bytes_total. These metrics describe host capacity and pressure, which cAdvisor cannot replace.
The Compose service mounts /proc, /sys, and the host root filesystem into the container. Node Exporter then points its collectors at those mounted paths:
Source: deployments/docker-compose/docker-compose.yaml
node-exporter:
  image: prom/node-exporter:latest
  platform: linux/amd64
  restart: unless-stopped
  volumes:
    - /proc:/host/proc:ro
    - /sys:/host/sys:ro
    - /:/rootfs:ro
  command:
    - '--path.procfs=/host/proc'
    - '--path.rootfs=/rootfs'
    - '--path.sysfs=/host/sys'
  ports:
    - '9100:9100' # Node Exporter metrics endpoint
Prometheus scrapes the exporter and adds labels that identify this target as host telemetry:
Source: deployments/configs/prometheus.yaml
- job_name: 'node-exporter'
  static_configs:
    - targets: ['node-exporter:9100']
  metric_relabel_configs:
    - target_label: origin_prometheus
      replacement: prometheus
    - target_label: integration
      replacement: node-host-metrics
The distinction between the two labels is intentional. origin_prometheus records that Prometheus scraped the target, while integration identifies the semantic source of the metrics. A dashboard can therefore filter host metrics explicitly:
100 * (1 - avg by (instance) (rate(node_cpu_seconds_total{integration="node-host-metrics", mode="idle"}[5m])))Why use both exporters?
Using only Node Exporter gives you the host's aggregate view. You may know that memory is nearly full, but not which container caused the pressure. Using only cAdvisor gives you container-level usage, but not the complete host view needed to understand available capacity, filesystem exhaustion, CPU saturation, or network pressure.
Together they support a useful troubleshooting path:
- Start with application metrics to find a slow endpoint, failing dependency, or abnormal request rate.
- Use cAdvisor to identify which container is using CPU, memory, disk, or network resources.
- Use Node Exporter to check whether the Docker host has enough remaining capacity or whether the pressure affects the entire machine.
- Use traces and logs in Grafana to connect the resource symptom to a request or error.
This layered view also helps alerting. An alert on high container memory can identify a leaking or oversized service. An alert on low host memory or filesystem space can warn about a shared infrastructure problem before it affects every container. The exporters do not replace application instrumentation; they add the runtime context needed to interpret it.
Tempo's internal OTLP port (4317) is used only by the Collector — it does not conflict with the Collector's own 4317 because they are on separate containers on the same Docker network.
OpenTelemetry Collector Configuration
The Collector is the heart of the pipeline. Its configuration (otel-collector-config.yaml) defines receivers, processors, and exporters:
Source: deployments/configs/otel-collector-config.yaml
# deployments/configs/otel-collector-config.yaml
receivers:
  otlp:
    protocols:
      grpc:
        endpoint: 0.0.0.0:4317
      http:
        endpoint: 0.0.0.0:4318

processors:
  batch:
    timeout: 1s
    send_batch_size: 1024
  transform/environment:
    error_mode: ignore
    trace_statements:
      - context: resource
        statements:
          - set(attributes["environment"], "development")
    log_statements:
      - context: resource
        statements:
          - set(attributes["environment"], "development")
    metric_statements:
      - context: resource
        statements:
          - set(attributes["environment"], "development")

exporters:
  # Default: expose processed application metrics for Prometheus to scrape.
  prometheus:
    endpoint: 0.0.0.0:8889
    resource_to_telemetry_conversion:
      enabled: true

    # Alternative: push metrics through Prometheus's OTLP HTTP receiver.
    # Enable this exporter in the metrics pipeline and configure Prometheus
    # with --web.enable-otlp-receiver.
    # otlphttp/prometheus:
    #   endpoint: "${env:PROMETHEUS_ENDPOINT}"
    #   tls:
    #     insecure: true
    tls:
      insecure: true

  otlphttp/loki:
    endpoint: '${env:LOKI_ENDPOINT}'
    tls:
      insecure: true

  otlp/tempo:
    endpoint: '${env:TEMPO_URL}'
    tls:
      insecure: true

  otlp/aspire:
    endpoint: '${env:ASPIRE_OTLP_ENDPOINT}'
    headers:
      x-otlp-api-key: '${env:ASPIRE_API_KEY}'
    tls:
      insecure: ${env:ASPIRE_INSECURE}
      insecure_skip_verify: true

  elasticsearch:
    endpoints:
      - '${env:ELASTICSEARCH_ENDPOINT}'
    mapping:
      mode: otel
    sending_queue:
      enabled: true
    retry:
      enabled: true

  debug:
    verbosity: basic

service:
  pipelines:
    traces:
      receivers: [otlp]
      processors: [batch, transform/environment]
      exporters: [otlp/tempo, otlp/aspire, elasticsearch, debug]
    metrics:
      receivers: [otlp]
      processors: [batch, transform/environment]
      exporters: [prometheus, otlp/aspire, debug]
      # Alternative push pipeline: [otlphttp/prometheus, otlp/aspire, debug]
    logs:
      receivers: [otlp]
      processors: [batch, transform/environment]
      exporters: [otlphttp/loki, otlp/aspire, elasticsearch, debug]
Key design decisions here:
prometheusis the default exporter. It exposes processed Collector metrics athttp://otel-collector:8889/metrics; Prometheus pulls that endpoint using its normal scrape loop. Resource attributes are converted to Prometheus labels throughresource_to_telemetry_conversion.otlphttp/prometheusis the alternative push exporter. Uncomment it in the metrics pipeline, setPROMETHEUS_ENDPOINT, and enable Prometheus's--web.enable-otlp-receiverflag. This sends OTLP metrics tohttp://prometheus:9090/api/v1/otlp.otlphttp/lokisends logs as OTLP HTTP. Loki'sallow_structured_metadata: truepreserves OTel resource attributes.otlp/temposends traces over gRPC, which Tempo receives on its own OTLP endpoint.elasticsearchuses the native Elasticsearch exporter withmapping: mode: otel, which maps OTel semantic conventions to Elastic's schema.- The
transform/environmentprocessor tags all signals withenvironment=development, making it easy to filter by environment in dashboards.
How Metrics Flow: Collector → Prometheus via Scraping
This is the trickiest piece of the pipeline, so let's trace it step by step:
%%{init: {
  'theme': 'base',
  'themeVariables': {
    'background': '#fafaf7',
    'primaryColor': '#ffffff',
    'primaryTextColor': '#0f172a',
    'primaryBorderColor': '#cbd5e1',
    'lineColor': '#475569',
    'secondaryColor': '#f3f4f6',
    'tertiaryColor': '#f3f4f6',
    'fontFamily': 'Geist, ui-sans-serif, sans-serif',
    'fontSize': '14px',
    'edgeLabelBackground': '#fafaf7',
    'nodeBorder': '2px',
    'mainBkg': '#fafaf7',
    'nodePadding': '12px',
    'actorBkg': '#ffffff',
    'actorBorder': '#0f172a',
    'actorTextColor': '#0f172a',
    'signalColor': '#475569',
    'signalTextColor': '#475569',
    'labelBoxBkgColor': '#f3f4f6',
    'labelBoxBorderColor': '#cbd5e1',
    'labelTextColor': '#0f172a',
    'loopTextColor': '#0f172a',
    'noteBorderColor': '#0284c7',
    'noteBkgColor': '#e6f4fb',
    'noteTextColor': '#0f172a'
  }
}}%%
sequenceDiagram
    participant APP as .NET Service
    participant COL as OTel Collector
    participant PROM as Prometheus

    APP->>COL: OTLP metrics (gRPC :4317)
    Note over COL: prometheus exporter<br/>exposes :8889/metrics
    PROM->>COL: GET /metrics (HTTP)
Note over PROM: scrape_configs target<br/>otel-collector:8889- The .NET service emits metrics over OTLP gRPC to the Collector on port
4317. - The Collector's
prometheusexporter translates processed OTel metrics into Prometheus exposition format and exposes them athttp://otel-collector:8889/metrics. - Prometheus periodically scrapes that endpoint through its
scrape_configsentry and stores the samples in its time-series database. resource_to_telemetry_conversionconverts resource attributes such asservice.nameinto Prometheus labels.
Two sides must match:
- Collector side:
prometheusexporter listening on0.0.0.0:8889 - Prometheus side:
scrape_configstargetotel-collector:8889
Prometheus scraping is the default because it keeps Prometheus's native pull model and avoids enabling a separate OTLP ingest endpoint. The OTLP push route remains useful when a platform standardizes on OTLP ingestion; both sides must then be switched together.
Pull-Based Metrics: Collector Exposes /metrics
Pull-based means Prometheus initiates the request. The Collector receives OTLP metrics from the application, processes them, and exposes the result as a Prometheus text endpoint:
.NET service --OTLP--> OTel Collector :4317
Prometheus  --GET----> OTel Collector :8889/metrics
The Collector's prometheus exporter listens on 0.0.0.0:8889. Prometheus reaches it by the Docker service name otel-collector:8889 and the scrape_configs entry tells Prometheus to request /metrics every ten seconds. Prometheus then parses the response and stores the samples in its local time-series database.
This approach keeps the responsibilities clear: the Collector translates and exposes metrics, while Prometheus controls scrape timing, target health, retries, and storage. A failed target is visible as a scrape failure, and the Prometheus Targets page shows whether otel-collector:8889 is healthy.
Push-Based Metrics: Collector Sends OTLP to Prometheus
Push-based means the Collector initiates the request. Instead of exposing /metrics, the Collector uses the otlphttp/prometheus exporter and sends OTLP metrics to Prometheus's OTLP HTTP receiver:
.NET service --OTLP------> OTel Collector :4317
OTel Collector --OTLP HTTP--> Prometheus :9090/api/v1/otlp
To use this alternative, enable Prometheus's --web.enable-otlp-receiver command-line option, configure the otlp: section in prometheus.yaml if resource attribute promotion is needed, and switch the Collector metrics pipeline from prometheus to otlphttp/prometheus. The endpoint must match on both sides:
# Collector exporter
otlphttp/prometheus:
  endpoint: 'http://prometheus:9090/api/v1/otlp'
  tls:
    insecure: true

# Collector metrics pipeline
metrics:
  exporters: [otlphttp/prometheus, otlp/aspire, debug]
Prometheus must also be started with:
command:
  - '--config.file=/etc/prometheus/prometheus.yml'
  - '--web.enable-otlp-receiver'
Do not enable both exporters for the same application metrics unless you intentionally want duplicate series. Select one complete path: prometheus plus a scrape target, or otlphttp/prometheus plus the Prometheus OTLP receiver.
Which Approach Should You Use?
Use pull-based scraping as the default, as this sample does. It follows Prometheus's normal operating model, makes target health visible in Prometheus, and avoids opening an additional OTLP ingestion path on the Prometheus server. It is also easy to understand when debugging: check the Collector endpoint at http://localhost:8889/metrics and check the target status in Prometheus.
Use push-based OTLP when your environment specifically requires OTLP ingestion, when a central telemetry design standardizes on push, or when scrape-based discovery is difficult. It can simplify the Collector-to-backend connection, but it requires enabling and securing Prometheus's OTLP receiver and carefully configuring both components.
The sample's final choice is therefore:
- Default: Collector
prometheusexporter on port8889, scraped by Prometheus. - Alternative: Collector
otlphttp/prometheusexporter to Prometheus port9090, with--web.enable-otlp-receiverenabled.
The Collector's environment variables are injected by the Compose file:
Source: deployments/docker-compose/docker-compose.yaml
# docker-compose.yaml (excerpt)
otel-collector:
  environment:
    - ASPIRE_OTLP_ENDPOINT=${ASPIRE_OTLP_ENDPOINT:-host.docker.internal:16224}
    - ASPIRE_API_KEY=${ASPIRE_API_KEY:-}
    - ASPIRE_INSECURE=true
    - PROMETHEUS_ENDPOINT=http://prometheus:9090/api/v1/otlp # optional OTLP push mode
    - LOKI_ENDPOINT=http://loki:3100/otlp
    - TEMPO_URL=tempo:4317
    - ELASTICSEARCH_ENDPOINT=http://elasticsearch:9200
MinIO: S3 Object Storage for Loki & Tempo
By default, Loki and Tempo use local filesystem storage — simple, but not durable. Recreate the container and you lose your logs and traces. MinIO is an S3-compatible object store that gives you persistent, scalable storage without changing a single line of application code.
The Docker Compose file defines two cooperating services: the MinIO server and a bucket creator that runs once to initialize the loki and tempo buckets:
Source: deployments/docker-compose/docker-compose.yaml
# docker-compose.yaml (minio services excerpt)
minio:
  image: minio/minio:latest
  restart: unless-stopped
  command:
    - server
    - /data
    - --console-address
    - :9001
  environment:
    MINIO_ROOT_USER: ${MINIO_USER:-minioadmin}
    MINIO_ROOT_PASSWORD: ${MINIO_PASSWORD:-minioadmin}
    MINIO_PROMETHEUS_AUTH_TYPE: public
  ports:
    - '9000:9000' # MinIO S3 API
    - '9001:9001' # MinIO Console UI
  volumes:
    - minio_data:/data

minio-bucket-creator:
  image: minio/mc:latest
  restart: on-failure
  entrypoint:
    - /bin/sh
  command:
    - -c
    - |
      /usr/bin/mc alias set myminio http://minio:9000 $${MINIO_USER} $${MINIO_PASSWORD}
      /usr/bin/mc mb myminio/loki --ignore-existing
      /usr/bin/mc anonymous set public myminio/loki
      /usr/bin/mc mb myminio/tempo --ignore-existing
      /usr/bin/mc anonymous set public myminio/tempo
      exit 0
  environment:
    MINIO_USER: ${MINIO_USER:-minioadmin}
    MINIO_PASSWORD: ${MINIO_PASSWORD:-minioadmin}
  depends_on:
    minio:
      condition: service_started
The minio-bucket-creator runs mc (the MinIO CLI) to create two buckets — loki for log chunks and tempo for trace blocks — then exits immediately. The --ignore-existing flag makes the command idempotent: safe to restart.
Tempo and Loki are configured to wait for this setup before starting:
# docker-compose.yaml (tempo + loki excerpt)
tempo:
  image: grafana/tempo:latest
  restart: unless-stopped
  command: ['-config.file=/etc/tempo.yaml', '-config.expand-env=true']
  environment:
    - MINIO_USER=${MINIO_USER:-minioadmin}
    - MINIO_PASSWORD=${MINIO_PASSWORD:-minioadmin}
  depends_on:
    minio-bucket-creator:
      condition: service_completed_successfully

loki:
  image: grafana/loki:latest
  restart: unless-stopped
  command: -config.file=/etc/loki/local-config.yaml -config.expand-env=true
  environment:
    - MINIO_USER=${MINIO_USER:-minioadmin}
    - MINIO_PASSWORD=${MINIO_PASSWORD:-minioadmin}
  depends_on:
    minio-bucket-creator:
      condition: service_completed_successfully
The MINIO_USER and MINIO_PASSWORD env vars are passed through so Tempo and Loki can authenticate to the S3 API. The -config.expand-env=true flag is critical: without it, Tempo and Loki see the literal string ${MINIO_USER} instead of the actual value, and both crash with InvalidAccessKeyId. Loki supports this flag from v2.1 onward; Tempo follows the same convention.
Prometheus Configuration
Prometheus uses its native pull model. The Collector exposes processed application metrics at :8889/metrics, while Prometheus scrapes that endpoint alongside its own and infrastructure metrics:
Source: deployments/docker-compose/docker-compose.yaml
# docker-compose.yaml (prometheus service excerpt)
prometheus:
  image: prom/prometheus:latest
  restart: unless-stopped
  ports:
    - '9090:9090' # Prometheus UI and query API
  volumes:
    - ./../configs/prometheus.yaml:/etc/prometheus/prometheus.yml
  command:
    - '--config.file=/etc/prometheus/prometheus.yml'
    - '--storage.tsdb.path=/prometheus'
    - '--enable-feature=native-histograms'
    - '--log.level=info'
Source: deployments/configs/prometheus.yaml
# deployments/configs/prometheus.yaml
global:
  scrape_interval: 15s
  evaluation_interval: 15s
  external_labels:
    collector: otel-collector

# Default: Prometheus pulls application metrics from the Collector's
# Prometheus exporter at http://otel-collector:8889/metrics.
# This preserves Prometheus's native pull and scrape behavior.
#
# Alternative: push metrics through Prometheus's OTLP HTTP receiver. Uncomment
# this block, enable --web.enable-otlp-receiver in Docker Compose, and configure
# the Collector's otlphttp/prometheus exporter.
# otlp:
#   promote_resource_attributes:
#   - service.instance.id
#   - service.name
#   - service.namespace
#   - service.version

scrape_configs:
  - job_name: 'otel-collector-app'
    scrape_interval: 10s
    static_configs:
      - targets: ['otel-collector:8889']
    metric_relabel_configs:
      - target_label: integration
        replacement: application-metrics

  - job_name: 'otel-collector'
    scrape_interval: 10s
    static_configs:
      - targets: ['otel-collector:8888']
    metric_relabel_configs:
      - target_label: integration
        replacement: collector-self-metrics

  - job_name: 'prometheus'
    static_configs:
      - targets: ['prometheus:9090']
    metric_relabel_configs:
      - target_label: integration
        replacement: prometheus-self-metrics

  - job_name: 'node-exporter'
    static_configs:
      - targets: ['node-exporter:9100']
    metric_relabel_configs:
      - target_label: integration
        replacement: node-host-metrics

  - job_name: 'tempo'
    static_configs:
      - targets: ['tempo:3200']
    metric_relabel_configs:
      - target_label: integration
        replacement: tempo-self-metrics
The otel-collector-app target pulls application metrics from the Collector's Prometheus exporter. The resource_to_telemetry_conversion option on the Collector converts resource attributes into labels before Prometheus scrapes them.
The scrape targets provide self-observability: you can monitor the Collector's own throughput, Prometheus internals, and the host machine's CPU/memory/disk through the node-exporter.
Tempo Configuration (S3-Backed)
Tempo stores trace blocks in MinIO while keeping the write-ahead log on local disk for performance. It receives OTLP traces from the Collector over gRPC and derives RED metrics from spans:
Source: deployments/configs/tempo.yaml
# deployments/configs/tempo.yaml
stream_over_http_enabled: true
server:
  http_listen_port: 3200
  log_level: info

distributor:
  receivers:
    otlp:
      protocols:
        grpc:
          endpoint: '0.0.0.0:4317'
        http:
          endpoint: '0.0.0.0:4318'

ingester:
  max_block_duration: 5m
  lifecycler:
    ring:
      kvstore:
        store: inmemory
      replication_factor: 1

compactor:
  compaction:
    block_retention: 1h

metrics_generator:
  registry:
    external_labels:
      source: tempo
      cluster: docker-compose
  storage:
    path: /var/tempo/generator/wal
    remote_write:
      - url: http://prometheus:9090/api/v1/write
        send_exemplars: true
  traces_storage:
    path: /var/tempo/generator/traces

storage:
  trace:
    backend: s3
    s3:
      endpoint: minio:9000
      bucket: tempo
      access_key: ${MINIO_USER}
      secret_key: ${MINIO_PASSWORD}
      insecure: true
    wal:
      path: /var/tempo/wal
    local:
      path: /var/tempo/blocks

overrides:
  defaults:
    metrics_generator:
      processors: [service-graphs, span-metrics, local-blocks]
      generate_native_histograms: both
The storage.trace.backend: s3 switch is the only change from local storage. The WAL (/var/tempo/wal) and temporary blocks (/var/tempo/blocks) stay on local disk — Tempo writes completed trace blocks to the tempo bucket on MinIO. The insecure: true flag is needed because MinIO runs without TLS in the local Docker network.
The metrics generator derives RED metrics (Rate, Error, Duration) and service graphs from spans with zero code changes. These are remote-written back to Prometheus, so Grafana shows both application metrics and span-derived metrics in one place. The generate_native_histograms: both flag enables high-precision histogram buckets for latency distributions.
Loki Configuration (S3-Backed)
Loki stores log chunks and the TSDB index in MinIO. The key settings are the storage_config.aws block pointing at MinIO and allow_structured_metadata: true for OTLP attribute preservation:
Source: deployments/configs/loki-config.yaml
# deployments/configs/loki-config.yaml
auth_enabled: false

server:
  http_listen_port: 3100

common:
  ring:
    instance_addr: 127.0.0.1
    kvstore:
      store: inmemory
  replication_factor: 1
  path_prefix: /tmp/loki

ingester:
  chunk_idle_period: 10s
  chunk_retain_period: 20s
  max_chunk_age: 30s
  wal:
    enabled: true
  lifecycler:
    ring:
      kvstore:
        store: inmemory
      replication_factor: 1

compactor:
  working_directory: /loki/compactor
  delete_request_store: s3
  compaction_interval: 10m
  retention_enabled: true
  retention_delete_delay: 2h
  retention_delete_worker_count: 150

schema_config:
  configs:
    - from: 2025-01-01
      store: tsdb
      object_store: s3
      schema: v13
      index:
        prefix: index_
        period: 24h

storage_config:
  aws:
    endpoint: http://minio:9000
    access_key_id: ${MINIO_USER}
    secret_access_key: ${MINIO_PASSWORD}
    bucketnames: loki
    s3forcepathstyle: true
    insecure: true
  tsdb_shipper:
    active_index_directory: /loki/index
    cache_location: /loki/index_cache
    cache_ttl: 24h

limits_config:
  allow_structured_metadata: true
The storage_config.aws block tells Loki to treat MinIO as an S3-compatible endpoint. s3forcepathstyle: true is required because MinIO uses path-style addressing rather than virtual-hosted-style. The ingester section controls how long Loki buffers logs in memory before flushing chunks to S3 — these short durations are fine for development; increase them in production to reduce S3 PUT operations.
The allow_structured_metadata: true flag is essential — without it, Loki strips OTel resource attributes from incoming OTLP log payloads. With it enabled, Grafana can filter logs by service_name, severity_text, and any other attribute pushed through the Collector's otlphttp/loki exporter.
Grafana Datasource Provisioning
Grafana datasources are provisioned declaratively so you never click through the UI:
Source: deployments/configs/grafana/provisioning/datasources/datasource.yml
# deployments/configs/grafana/provisioning/datasources/datasource.yml
apiVersion: 1
datasources:
  - name: Prometheus
    type: prometheus
    access: proxy
    url: http://prometheus:9090
    isDefault: true
    editable: false
    uid: prometheus-uid

  - name: Tempo
    type: tempo
    access: proxy
    url: http://tempo:3200
    editable: false
    uid: tempo-uid
    jsonData:
      httpMethod: GET
      tracesToLogsV2:
        datasourceUid: loki-uid
        spanStartTimeShift: '-5m'
        spanEndTimeShift: '5m'
        tags:
          - key: service_name
            value: service_name
      tracesToMetrics:
        datasourceUid: prometheus-uid
        spanStartTimeShift: '-5m'
        spanEndTimeShift: '5m'
      serviceMap:
        datasourceUid: prometheus-uid
      streamingEnabled:
        search: true

  - name: Loki
    type: loki
    access: proxy
    url: http://loki:3100
    editable: false
    uid: loki-uid
    jsonData:
      derivedFields:
        - datasourceUid: tempo-uid
          matcherRegex: "^.*?traceI[d|D]=(\\w+).*$"
          name: traceId
          url: '$${__value.raw}'

  - name: Elasticsearch
    type: elasticsearch
    access: proxy
    url: http://elasticsearch:9200
    editable: true
    uid: elasticsearch-uid
    jsonData:
      index: 'logs-readable'
      timeField: '@timestamp'
      maxConcurrentShardRequests: 10
      logMessageField: 'body.text'
      logLevelField: 'severity_text'
The Tempo-to-Loki link (tracesToLogsV2) enables the classic "click a span → see related logs" workflow. The Loki-to-Tempo derived field extracts traceId from log lines and turns it into a clickable link that opens the full trace waterfall in Tempo.
The Elasticsearch datasource points to the logs-readable filtered alias. The alias keeps records that contain body.text, so instrumentation records that carry only metadata do not appear as empty rows in Grafana Explore. The original logs-generic.otel-default data stream remains available in Elasticsearch.
Grafana Dashboard Provisioning
Datasource provisioning and dashboard provisioning solve different problems. The datasource file creates stable UIDs such as prometheus-uid; Grafana Hub dashboard files commonly contain an import placeholder named ${DS_PROMETHEUS}. Grafana resolves that placeholder during API import, but normal file provisioning does not resolve __inputs mappings.
Keep downloaded dashboard files unchanged in a separate source directory:
configs/grafana/
  provisioning/
    datasources/
      datasource.yml
    dashboards/
      dashboard.yml
  dashboards-source/
    aspnetcore.json
    aspnetcore-endpoint.json
    node-exporter.json
    postgresql.json
    rabbitmq.json
The dashboard provider points to an empty imported-dashboard location, so Grafana does not try to provision the source JSON directly:
Source: deployments/configs/grafana/provisioning/dashboards/dashboard.yml
# deployments/configs/grafana/provisioning/dashboards/dashboard.yml
apiVersion: 1
providers:
  - name: default
    orgId: 1
    folder: ''
    type: file
    options:
      path: /var/lib/grafana/dashboards-imported
The grafana-dashboard-importer container reads dashboards-source/*.json and calls Grafana's /api/dashboards/import endpoint. Its inputs mapping connects DS_PROMETHEUS to the provisioned Prometheus datasource. The script sets id to null and derives a stable UID from each filename, allowing repeated imports to update the same dashboard without changing the downloaded source.
Source: deployments/docker-compose/docker-compose.yaml
# deployments/docker-compose/docker-compose.yaml
grafana-dashboard-importer:
  image: python:3.13-alpine
  environment:
    GF_SECURITY_ADMIN_USER: admin
    GF_SECURITY_ADMIN_PASSWORD: admin
    GRAFANA_URL: http://grafana:3000
  volumes:
    - ./import-dashboards.py:/import-dashboards.py:ro
    - ./../configs/grafana/dashboards-source:/dashboards:ro
  command: ['python', '/import-dashboards.py']
Python runs inside the importer container; the host does not need Python installed. The container waits for Grafana's health endpoint, imports each source file, and exits. This is convenient for local Compose and bootstrap environments. For production, use protected credentials, stable UIDs, and a controlled import process rather than the development admin/admin credentials.
Recommended Development and Production Approaches
The important rule is to separate dashboard source from dashboard deployment. Treat each Grafana Hub JSON file as an upstream artifact. Store the original file under dashboards-source/, keep ${DS_PROMETHEUS} and other Hub placeholders intact, and never edit that file merely to make it work with one Grafana instance. This keeps upgrades and re-downloads predictable and makes it possible to compare local files with the upstream dashboard.
| Environment | Recommended deployment | Why |
|---|---|---|
| Development | Compose importer using the Grafana API | Fast startup, easy datasource mapping, and no manual UI import. |
| Production | Scripted API import or manual import, depending on change frequency | Balances repeatability against operational simplicity. |
For development, the Compose importer is the most convenient option. It waits until Grafana is healthy, maps DS_PROMETHEUS to the provisioned datasource, imports dashboards with overwrite: true, and exits. Developers can replace a source JSON file and restart the importer without changing the upstream dashboard itself. The development credentials in this sample are intentionally simple and must not be reused in a shared or production environment.
For production, choose between two approaches. A script is better when several dashboards must be imported, datasource placeholders must be mapped consistently, or dashboards are recreated often. The script should validate JSON, use a protected Grafana service account or token, import through the API, and use a deterministic UID for every dashboard. This makes repeated imports predictable.
Manual import is reasonable for a small number of dashboards that change rarely. In Grafana, open Dashboards > New > Import, upload the unchanged Hub JSON, select the correct datasource when prompted, and save the dashboard. Manual import is easy to understand, but it depends on operator steps and can create inconsistent datasource or UID settings between environments.
Our recommendation is to use the script for the Compose sample and for production when dashboards are managed as a group. Use manual import for occasional one-off dashboards. In both cases, keep the original Grafana Hub JSON unchanged, avoid editing ${DS_PROMETHEUS} in the source file, and preserve stable dashboard UIDs after import.
The sample therefore uses a simple boundary: declarative YAML provisions datasources, untouched Hub JSON remains under dashboards-source/, and a small API importer performs the placeholder substitution and dashboard creation. This solves the ${DS_PROMETHEUS} error without corrupting the original dashboard files.
The Elasticsearch datasource is an optional bridge: it brings logs and metrics from Elasticsearch into Grafana, so you can query both backends without switching tools. For example, you can run a Lucene full-text search against Elasticsearch logs in the same Explore view where you write PromQL and LogQL. Trace waterfalls and service graphs from Elasticsearch are not rendered in Grafana — for those you use Kibana, where Elastic APM provides native trace views, span waterfalls, and dependency maps.
Note on the ELK stack: Elasticsearch and Kibana run side-by-side with the LGTM stack in this article as an optional alternative. In production you would typically pick one observability path — either LGTM (Grafana-native: Prometheus + Tempo + Loki) or ELK (Elastic-native: Elasticsearch + Kibana). Kibana is the Grafana equivalent for the ELK world: it unifies logs (Discover), traces (APM), and metrics (Lens and Dashboards) under one UI — the same role Grafana fills for the LGTM stack. The choice comes down to operational preference: LGTM is lighter and more cloud-native; ELK gives you powerful full-text search, Elastic APM, and machine learning features.
Part 3: Running the Stack
Step 1: Start the Infrastructure
cd deployments/docker-compose
docker compose -f docker-compose.yaml up -d
Wait for all containers to be healthy (docker ps should show all services running).
Step 2: Run the AppHost
cd samples/observability-aspire-opentelemetry-dotnet/aspireshop
dotnet run --project AspireShop.AppHost
The AppHost starts postgres, basketcache, catalogdbmanager, catalogservice, basketservice, and frontend. Each service receives the OTLP endpoint and starts exporting telemetry.
Step 3: Generate Traffic
Open the frontend at the HTTPS endpoint shown in the Aspire dashboard. When running the Frontend project directly with its HTTPS launch profile, the default URL is https://localhost:7276. Browse products and add items to the basket. Every click generates spans, metrics, and logs.
Step 4: Explore in Grafana
Open http://localhost:3000 (login: admin / admin).
Metrics (Prometheus) — Use the Explore view with the Prometheus datasource. Try queries like:
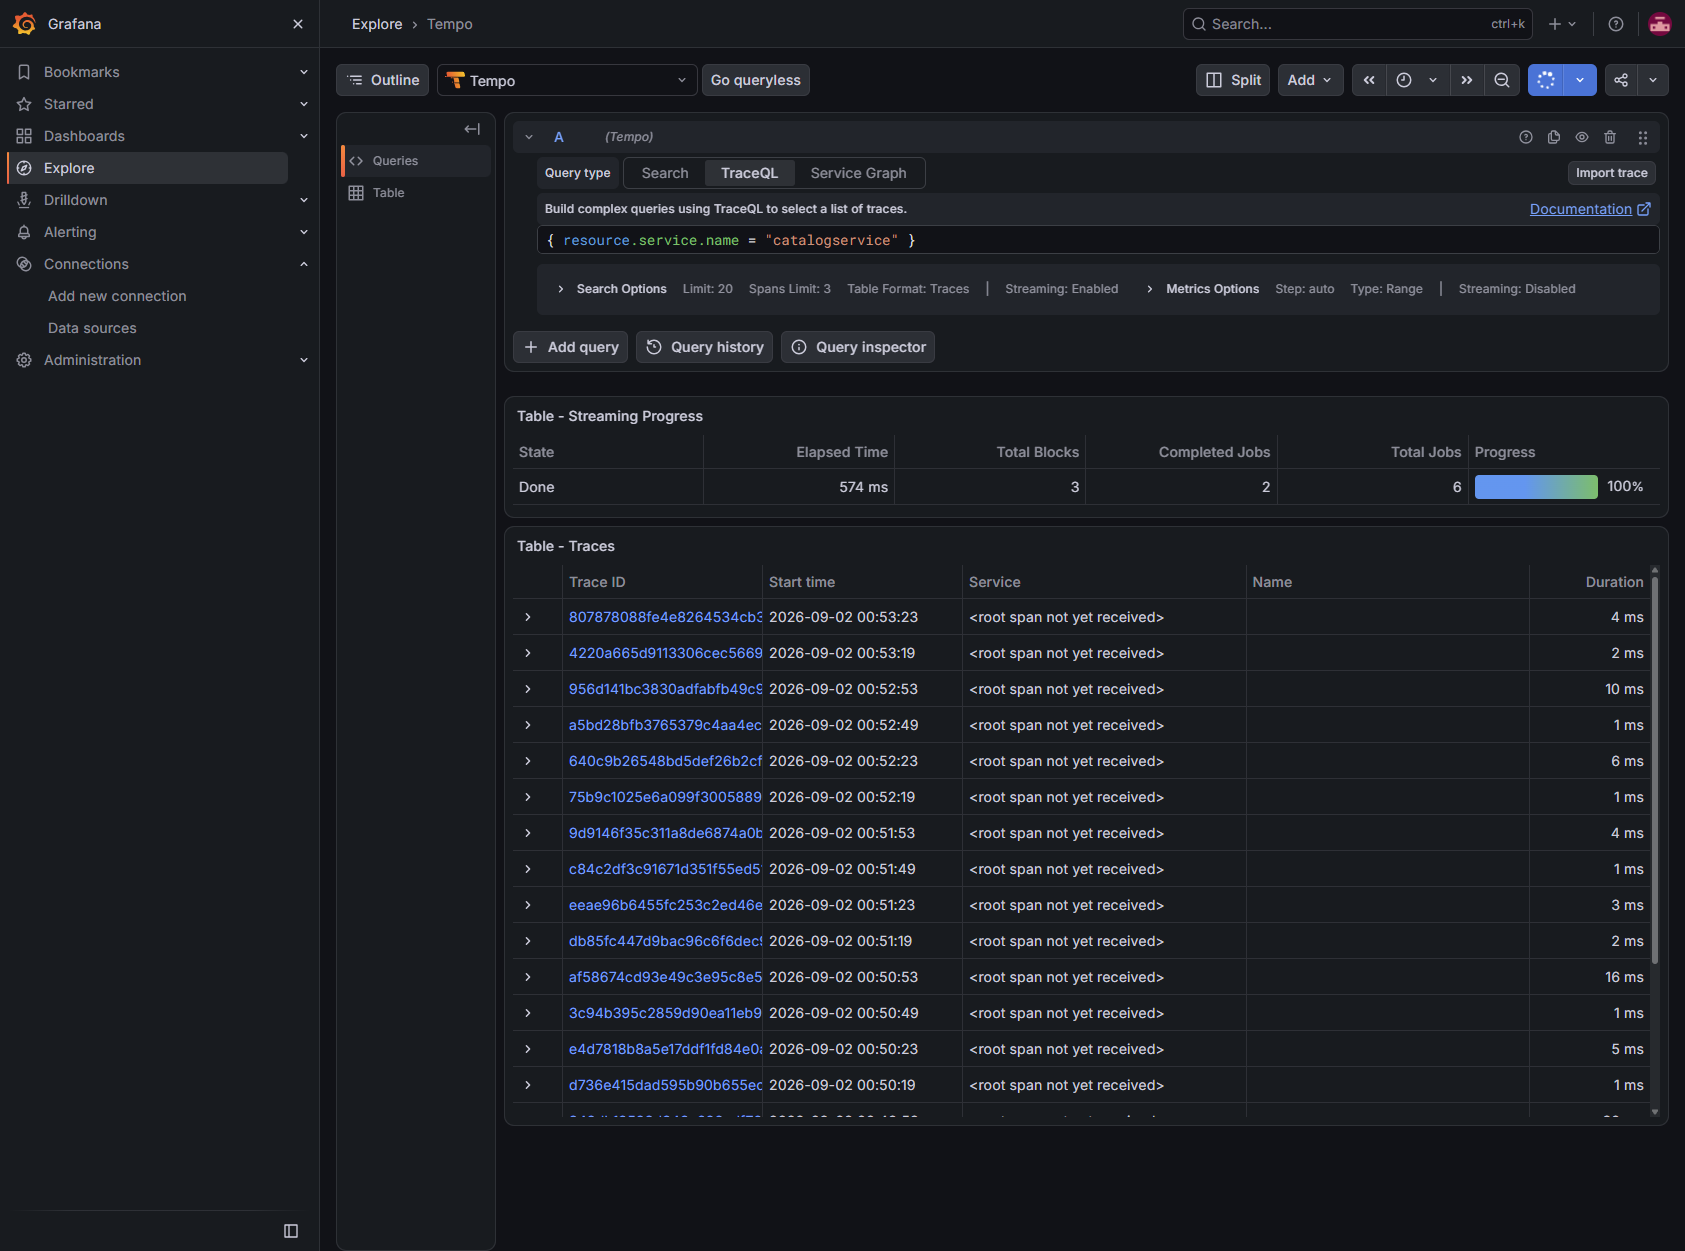
rate(http_server_request_duration_seconds_count[1m])Traces (Tempo) — Switch to the Tempo datasource. Use TraceQL:
{ .service.name = "catalogservice" }Click any trace to see the waterfall, then click a span and choose "View related logs" to jump to Loki.
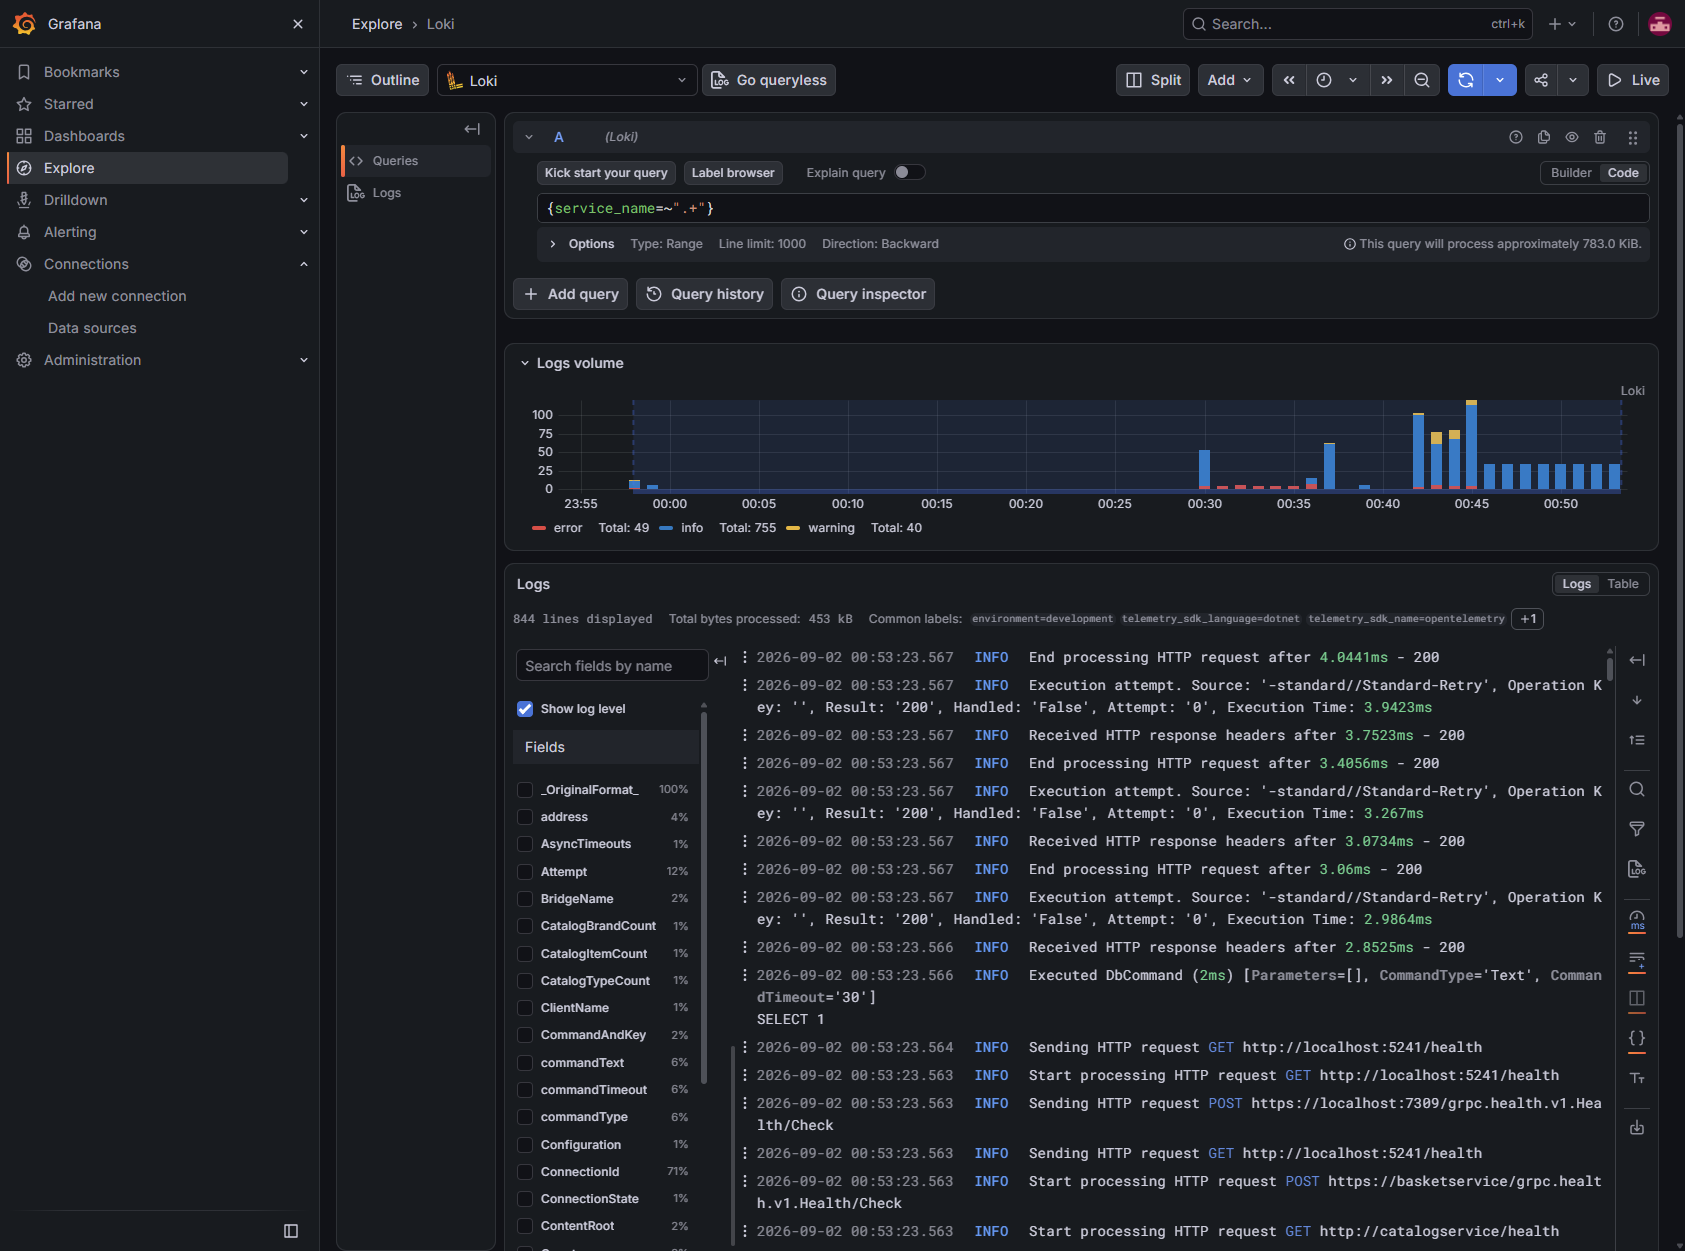
Logs (Loki) — Switch to the Loki datasource. Use LogQL:
{service_name="catalogservice"} |= ""Log lines with trace IDs will have clickable links back to Tempo.
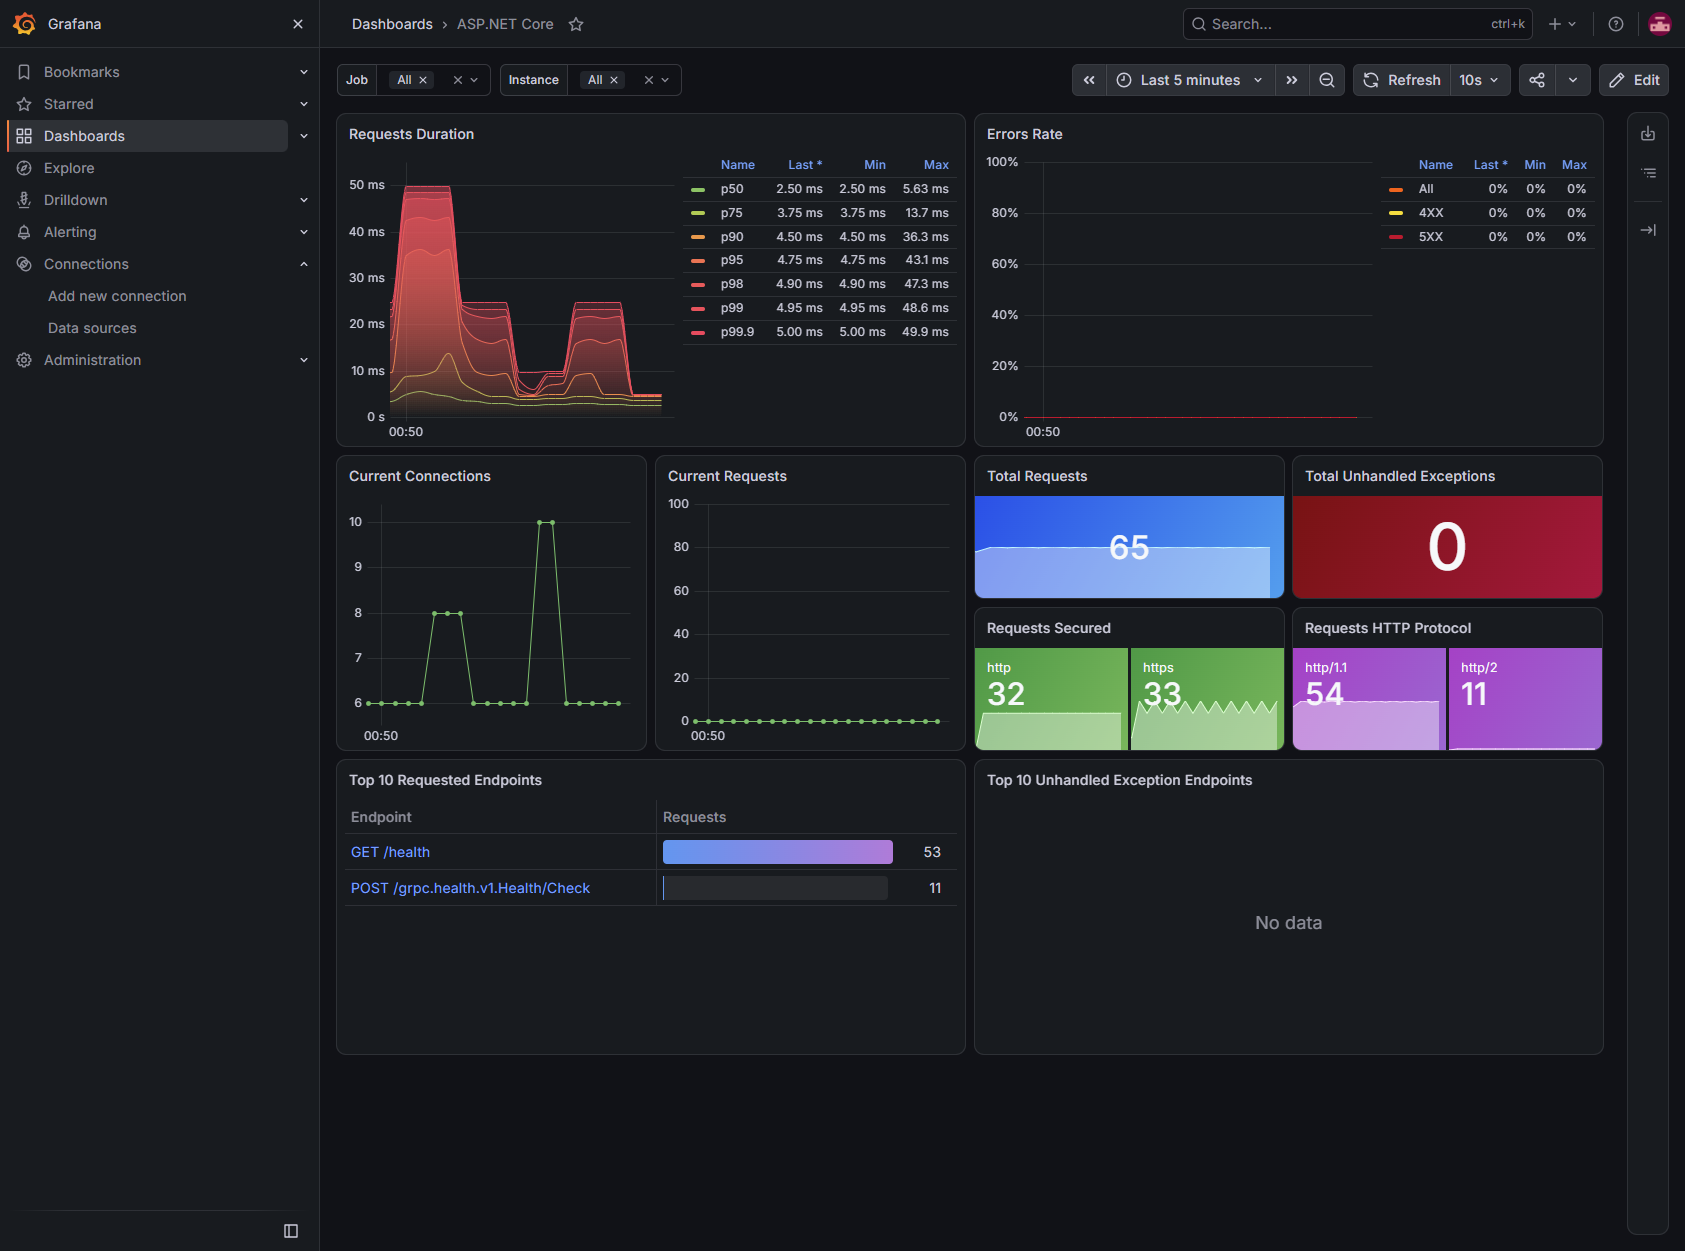
The ASP.NET Core dashboard gives a service-level view of request duration, error rate, connections, and endpoint traffic. It is useful for spotting a performance or availability change before drilling into an individual trace or log line.
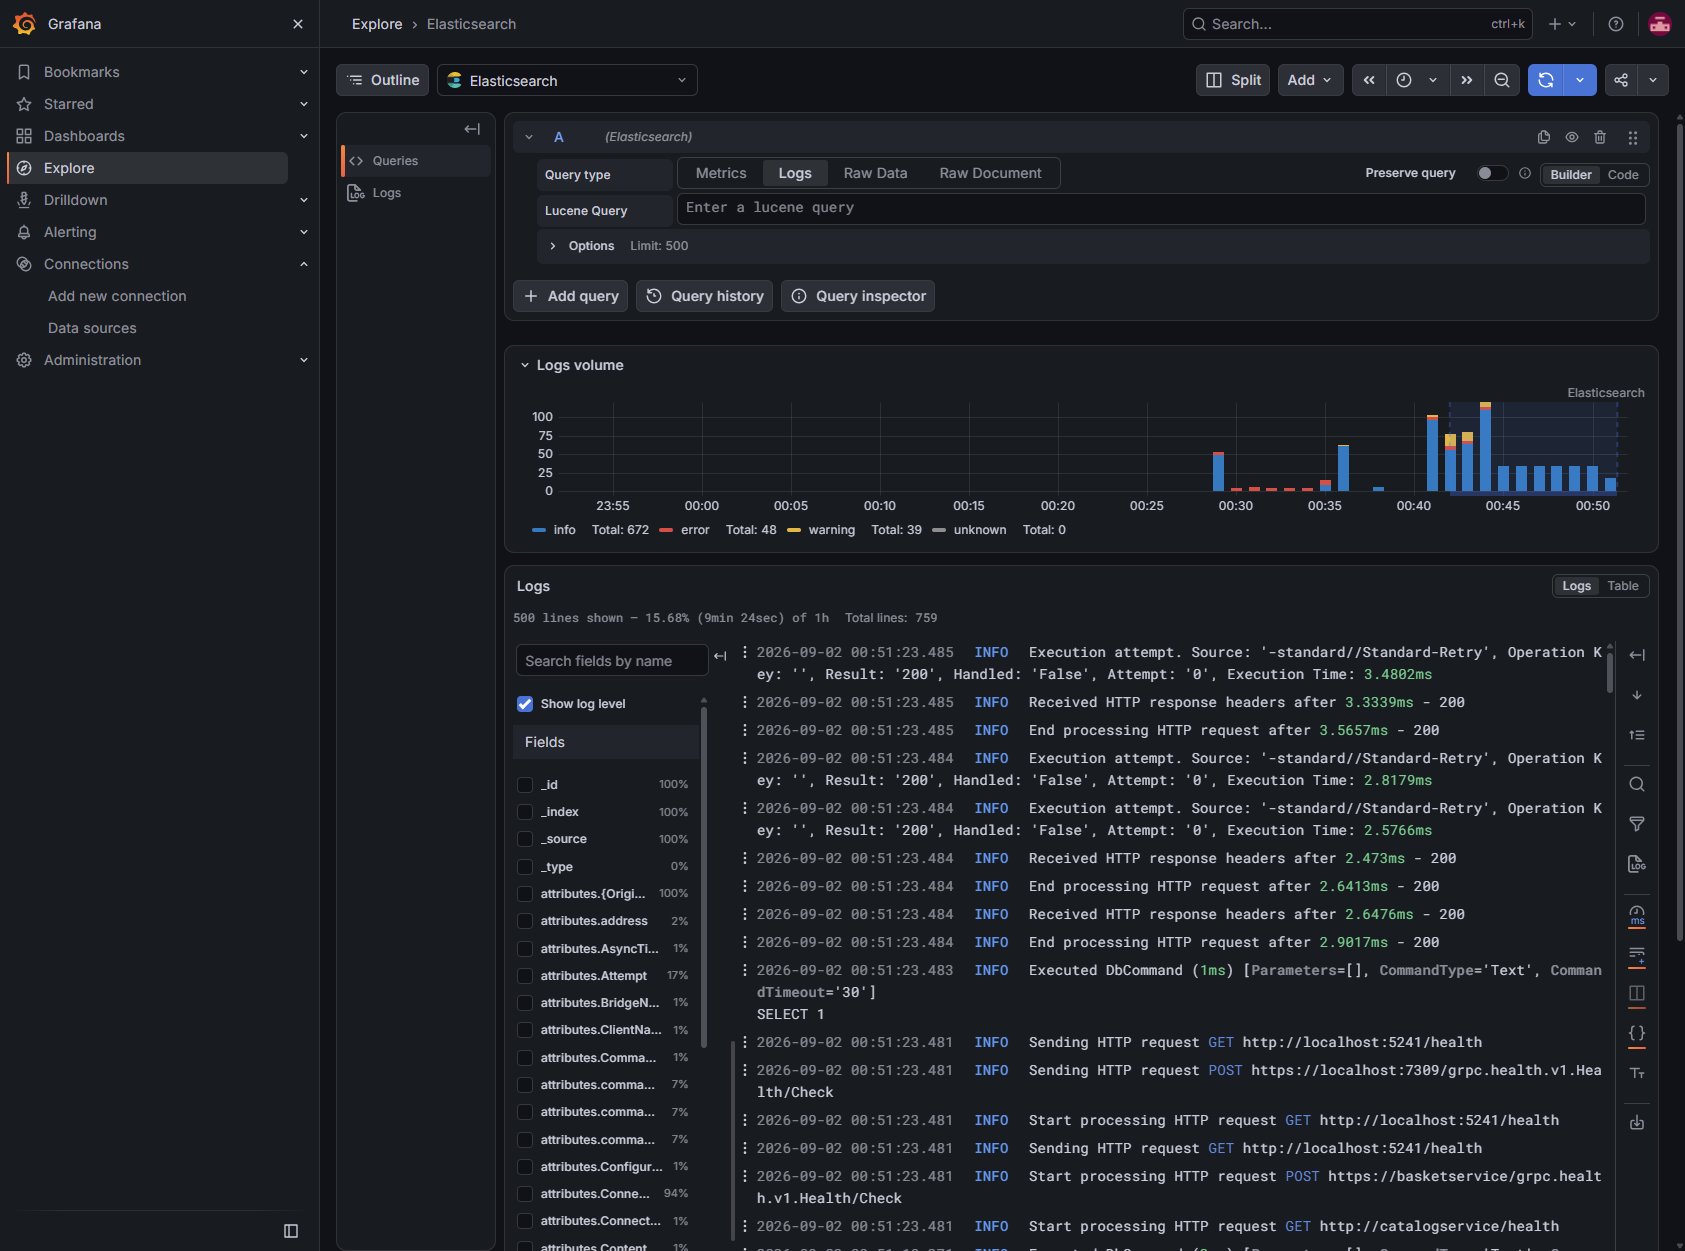
The Elasticsearch datasource exposes the same application activity through Lucene-backed log search. In this setup, the filtered alias removes bodyless instrumentation records, leaving readable messages such as HTTP requests and database commands.
Step 5: Explore the Optional ELK Stack
Open http://localhost:5601 for Kibana. Think of Kibana as the Grafana equivalent for the ELK stack — one UI that covers all three signals:
| Signal | Kibana Tool | Grafana Equivalent |
|---|---|---|
| Logs | Discover | Loki Explore view |
| Traces | APM | Tempo trace waterfall |
| Metrics | Lens / Dashboards | Prometheus + Grafana panels |
Start with Analytics > Discover and select the logs-generic.otel-default data view. You will see the same logs flowing from the Collector, with Lucene full-text search and field-level filtering. For traces, head to APM > Services — the Collector pushes trace data to Elasticsearch with mapping: mode: otel, and Elastic APM surfaces service maps, latency distributions, and span waterfalls. For metrics, Dashboards and Lens let you build visualizations from Elasticsearch aggregations without learning a separate query language.
Back in Grafana, the Elasticsearch datasource (elasticsearch-uid) gives you a bridge: query Elasticsearch logs and metrics without leaving Grafana's interface. Use it when you want Elastic's full-text search power inside your existing Grafana dashboards.
One stack or two? Running both LGTM and ELK side by side is fine for learning, but in production pick one. Both stacks give you logs, traces, and metrics. The difference is where the data lives (object storage vs. Elasticsearch) and which UI you prefer (Grafana vs. Kibana).
Part 4: Understanding the Signal Flow
Let's trace a single user request through the entire pipeline:
%%{init: {
  'theme': 'base',
  'themeVariables': {
    'background': '#fafaf7',
    'primaryColor': '#ffffff',
    'primaryTextColor': '#0f172a',
    'primaryBorderColor': '#cbd5e1',
    'lineColor': '#475569',
    'secondaryColor': '#f3f4f6',
    'tertiaryColor': '#f3f4f6',
    'fontFamily': 'Geist, ui-sans-serif, sans-serif',
    'fontSize': '14px',
    'edgeLabelBackground': '#fafaf7',
    'nodeBorder': '2px',
    'mainBkg': '#fafaf7',
    'nodePadding': '12px',
    'actorBkg': '#ffffff',
    'actorBorder': '#0f172a',
    'actorTextColor': '#0f172a',
    'signalColor': '#475569',
    'signalTextColor': '#475569',
    'labelBoxBkgColor': '#f3f4f6',
    'labelBoxBorderColor': '#cbd5e1',
    'labelTextColor': '#0f172a',
    'loopTextColor': '#0f172a',
    'noteBorderColor': '#0284c7',
    'noteBkgColor': '#e6f4fb',
    'noteTextColor': '#0f172a',
    'activationBorderColor': '#0f172a',
    'activationBkgColor': '#ffffff'
  }
}}%%
sequenceDiagram
    participant U as Browser
    participant FW as Frontend
    participant CS as CatalogService
    participant COL as OTel Collector
    participant T as Tempo
    participant L as Loki
    participant P as Prometheus
    participant G as Grafana

    U->>FW: GET /catalog
    FW->>CS: gRPC GetCatalogItems
    CS-->>FW: CatalogItem list
    FW-->>U: HTML page

    Note over FW,CS: Each service emits OTLP to Collector

    FW->>COL: spans + metrics + logs
    CS->>COL: spans + metrics + logs
    COL->>T: traces
    COL->>L: logs
    COL->>P: metrics
    G->>T: query traces
    G->>L: query logs
G->>P: query metrics- A request hits the Frontend, which calls CatalogService over gRPC.
- Both services emit spans (with trace context propagation), metrics (request duration, rate), and logs (ILogger entries).
- The Collector receives everything on
:4317, batches it, tags it withenvironment=development, and fans it out:- Traces → Tempo (gRPC)
- Metrics → Prometheus, which scrapes the Collector's
/metricsendpoint - Logs → Loki (OTLP HTTP) + Elasticsearch (native export)
- Grafana queries Tempo, Loki, Prometheus, and Elasticsearch through their respective datasources.
The trace context flows automatically because AddAspNetCoreInstrumentation and AddHttpClientInstrumentation handle W3C trace context propagation. gRPC calls propagate trace context via gRPC metadata.
Part 5: Choosing Between LGTM and ELK
Both stacks offer complete observability. Which one should you choose?
| Concern | LGTM (Prometheus + Tempo + Loki) | ELK (Elasticsearch + Kibana) |
|---|---|---|
| Metrics | Prometheus — de-facto standard for cloud-native metrics, PromQL, Alertmanager | Elasticsearch aggregations + Kibana Lens |
| Traces | Tempo — TraceQL, service graphs, no sampling required at ingest | Elastic APM — tight integration with Elasticsearch queries |
| Logs | Loki — low-cost, label-based, integrates with Promtail/OTel | Elasticsearch — powerful full-text search, Lucene query syntax |
| Storage | Object storage (S3/GCS/Azure) — cheap, scales horizontally | Local or cloud disks — requires more tuning for scale |
| Learning curve | Moderate — three different query languages (PromQL, TraceQL, LogQL) | Lower — one query language (Lucene/KQL), one store |
| Best for | Kubernetes-native, microservices, teams already using Prometheus | Full-text log analysis, security/APM use cases, single-vendor preference |
The AspireShop sample runs both side by side for demonstration. In a real project, pick one and keep your operational surface area smaller.
Conclusion
You have wired a .NET microservices application for full observability using open standards and open-source tooling. The recipe:
- .NET Aspire + Service Defaults gives you OTel instrumentation with zero-config defaults.
- AppHost environment injection keeps the OTLP endpoint configurable per environment.
- OTel Collector acts as a universal telemetry router — receive once, export everywhere.
- LGTM stack (Prometheus, Tempo, Loki, Grafana) provides a modern, scalable observability backend.
- ELK stack (Elasticsearch, Kibana) runs as an optional sidecar for teams that prefer Elastic-native tooling.
- Grafana ties everything together with cross-datasource linking (trace → logs, logs → trace).
The complete source code is available in the observability-aspire-opentelemetry-dotnet sample. It contains the Docker Compose files, Collector configurations, and Grafana provisioning files required to run the stack with a single docker compose up.