


Designing a DevSecOps GitHub Actions Pipeline for .NET: Quality, SAST, SCA, Signing, and DAST

Mehdi Hadeli
@mehdihadeli
On this page
Table of contents
Introduction
Once a .NET pipeline grows beyond restore, build, and test, the hard part is no longer adding tools. The hard part is deciding where each control belongs and how the stages should fit together.
A serious DevSecOps pipeline usually needs several different controls at same time:
- code quality checks
- secret detection
- SAST
- IaC and pipeline misconfiguration scanning
- application SCA and image SCA
- SBOM generation
- supply-chain signing and provenance
- post-deploy smoke, k6, and DAST against the real target runtime
If all of that gets pushed into one large GitHub Actions job, failures turn noisy and triage gets expensive. This article walks through a cleaner design: a split CI/CD model, narrow jobs, explicit artifact boundaries, separate security surfaces, and a trust chain that continues all the way to target-runtime verification.
What this article covers
- explain actual GitHub Actions stages in current sample
- explain why sample now splits CI and CD into separate workflows
- show where repo-local composite actions now carry the repeated setup, evidence, signing, and metadata logic
- show why each step exists and what it gates
- keep application and image evidence separate
- publish security findings into GitHub Security tab where possible
- preserve SBOMs and supply-chain trust metadata as first-class outputs
- show how
maindeploys todev, git tags deploy tostaging, andproductionis promoted only after successful staging checks and manual approval - show how the sample supports Azure Container Apps, AKS direct deploy, and AKS plus Flux from the same CD workflow
- show how target URL safety is enforced so tokens and signed query strings are not leaked through workflow outputs or evidence artifacts
- provide reusable sample references for readers who want to inspect full code
Architecture overview
The pipeline follows three simple rules.
First, cheap deterministic checks run early and fail fast.
Second, security evidence follows artifact boundaries. Source code, published app output, final container image, published registry artifact, and deployed runtime are related, but they are not the same surface.
Third, deploy only happens from signed CI output. CI builds and signs trusted artifacts. CD verifies the signed digest again before touching an environment.
One clarification before the walkthrough: the numbered sections below are an explanation order, not one giant workflow file. The sample now uses two workflows. ci.yaml handles source validation, SCA, publish, signing, attestation, and CI evidence. cd.yaml starts from workflow_run, reads that CI evidence, decides whether deployment is allowed, then deploys to dev or staging, runs smoke plus k6 plus ZAP, and promotes to production only when the staging path passes and the GitHub production environment approval gate is satisfied.
flowchart TD
  subgraph CI[ci.yaml]
    direction TB
    qualityCheck[quality-check] --> sastSemgrep[sast-semgrep]
    qualityCheck --> iacCheckov[sast-iac-checkov]
    qualityCheck --> sastCodeql[sast-codeql]
    qualityCheck --> sastSonar[sast-sonar]
    sastSemgrep --> dotnetBuildTest[dotnet-build-test]
    iacCheckov --> dotnetBuildTest
    sastCodeql --> dotnetBuildTest
    dotnetBuildTest --> dotnetAppSca[dotnet-app-sca-security]
    dotnetAppSca --> imageBuild[image-build]
    imageBuild --> imageSca[image-sca-security]
    sastSonar --> securityGate[security-gate]
    imageSca --> securityGate[security-gate]
    securityGate --> imagePublish[image-publish]
    imagePublish --> imageSign[image-sign]
    imageSign --> verifyCiSignature[verify-image-signature]
    imageSign --> attest[attest]
    verifyCiSignature --> ciRecord[record-and-notify]
    attest --> ciRecord
  end

  ciRecord --> decision{CI metadata says\nauto deploy?}
  decision -->|main push or merge| devRoute[route to dev\nshort SHA + dev tag]
  decision -->|git tag push| stageRoute[route to staging\ngit tag]

  subgraph CD[cd.yaml]
    direction TB
    prepareDeployment[prepare-deployment] --> verifyCdSignature[verify-image-signature]
    verifyCdSignature --> deploy[deploy]
    deploy --> smoke[post-deploy-smoke]
    smoke --> k6[post-deploy-k6]
    k6 --> zapBaseline[zap-baseline]
    zapBaseline --> promote{staging run\nand approved?}
    promote -->|no| cdRecord[record-and-notify]
    promote -->|yes| deployProd[deploy-production]
    deployProd --> smokeProd[post-deploy-smoke-production]
    smokeProd --> k6Prod[post-deploy-k6-production]
    k6Prod --> zapProd[zap-baseline-production]
    zapProd --> cdRecord
  end

  devRoute --> prepareDeployment
  stageRoute --> prepareDeployment
Repository shape
The sample now uses one CI workflow, one CD workflow, and repo-local composite actions.
Main pieces:
- CI workflow: ci.yaml
- CD workflow: cd.yaml
- reusable setup action: setup/action.yml
- quality actions: format, style, analyzers
- build and test actions: build, test
- shared metadata and evidence actions: resolve-version-metadata, create-ci-evidence, download-ci-evidence-artifacts
- supply-chain actions: sign-published-image, verify-keyless-image-signature, sign-keyless-blob
- local developer hooks: .husky
- sample API: src/DevSecOpsPipelineSample.Api
- project docs hub: docs/index.md
Workflow triggers and inputs
The sample now has two trigger models.
ci.yaml supports push, pull_request, and optional workflow_dispatch for manual image publication tests.
cd.yaml supports workflow_run on completed CI runs, then exits early unless that CI run concluded successfully and the CI metadata enables deployment.
The promotion policy is now explicit:
- pushes or merges to
mainpublish a short-SHA image and mark it fordev - git tag pushes publish an image tagged with the git tag and mark it for
staging productionis never targeted directly from CI evidence; it is promoted later from the CD workflow after successful staging validation- pull requests stop in CI and never auto-deploy
That version rule is centralized in the repo-local resolve-version-metadata action. Tagged builds use the tag name. Everything else uses the short commit SHA. The same build_version then feeds image naming, Dependency-Track project versions, Snyk target-reference, and CI evidence output.
This is the core of that reusable action:
runs:
  using: composite
  steps:
    - name: Resolve metadata
      id: resolve
      shell: bash
      run: |
        image_name="$(echo "$INPUT_REPOSITORY_NAME" | tr '[:upper:]' '[:lower:]')"
        short_sha="${GITHUB_SHA::7}"

        if [[ "$GITHUB_REF_TYPE" == "tag" ]]; then
          build_version="$GITHUB_REF_NAME"
        else
          build_version="$short_sha"
        fi

        echo "image_name=${image_name}" >> "$GITHUB_OUTPUT"
        echo "image_tag=${build_version}" >> "$GITHUB_OUTPUT"
        echo "build_version=${build_version}" >> "$GITHUB_OUTPUT"
        echo "image_ref=${INPUT_REGISTRY}/${image_name}:${build_version}" >> "$GITHUB_OUTPUT"
So when the workflow says uses: ./.github/actions/resolve-version-metadata, this is not magic. It is a thin normalization layer that keeps the tag-or-short-SHA rule consistent everywhere.
That decision is written into the CI evidence artifact as machine-readable metadata:
{
  "build": {
    "version": "abc1234"
  },
  "artifacts": {
    "signedImageWithDigest": "ghcr.io/owner/repo@sha256:..."
  },
  "deployment": {
    "autoDeploy": true,
    "targetEnvironment": "dev",
    "source": "main"
  }
}
That file is now produced by the repo-local create-ci-evidence action rather than by ad hoc shell embedded in the workflow.
The action logic is also worth seeing directly because it encodes the deployment intent:
- name: Generate evidence bundle
  shell: bash
  run: |
    AUTO_DEPLOY="false"
    TARGET_ENVIRONMENT=""
    DEPLOY_SOURCE="none"

    if [[ "${GITHUB_EVENT_NAME}" == "push" && "${GITHUB_REF}" == "refs/heads/main" ]]; then
      AUTO_DEPLOY="true"
      TARGET_ENVIRONMENT="dev"
      DEPLOY_SOURCE="main"
    elif [[ "${GITHUB_EVENT_NAME}" == "push" && "${GITHUB_REF_TYPE}" == "tag" ]]; then
      AUTO_DEPLOY="true"
      TARGET_ENVIRONMENT="staging"
      DEPLOY_SOURCE="tag"
    fi

    cat > "$OUTPUT_DIRECTORY/build-metadata.json" <<EOF
    {
      "build": { "version": "${BUILD_VERSION}" },
      "deployment": {
        "autoDeploy": ${AUTO_DEPLOY},
        "targetEnvironment": "${TARGET_ENVIRONMENT}",
        "source": "${DEPLOY_SOURCE}"
      }
    }
    EOF
That is why the CD workflow can stay small. The deployment decision is already computed once in CI and preserved as artifact data.
cd.yaml downloads that CI evidence bundle, reads the metadata, verifies the signed digest again, and only then deploys.
Why this matters in DevSecOps:
- it keeps pull requests build-only while allowing trusted branches to promote automatically
- it creates clear
main -> devandtag -> stagingrelease semantics - it makes CD consume signed CI output instead of rebuilding during deployment
- it lets
dev,staging, andproductionenvironment settings live in GitHub environment-scoped secrets and variables
The workflows also have a few top-level controls that are easy to miss when people focus only on jobs:
pathsfilters stop the pipeline from running on unrelated documentation-only changes- top-level
permissions: {}forces every job to ask only for the scopes it actually needs - CI
concurrencycancels older in-flight runs for same branch or pull request - CD
concurrencykeeps each deployment run isolated from other CI completions - shared
envvalues keep registry name, image tar path, and blocking Trivy severities consistent across jobs
Those pieces are not scanners, but they still matter. They cut noise, reduce accidental token exposure, and make release behavior easier to reason about.
Stage 1: quality check
quality-check is the cheap gate. It should fail the branch before heavier scanners consume runner time.
Current job does five things:
- checkout full history for secret scan context
- validate formatting
- validate style and warnings-as-errors policy
- run analyzers
- run Gitleaks and Hadolint
quality-check:
  steps:
    - name: Checkout code
      uses: actions/checkout@...
      with:
        fetch-depth: 0

    - name: Validate formatting
      uses: ./.github/actions/format

    - name: Validate style
      uses: ./.github/actions/style

    - name: Run analyzers
      uses: ./.github/actions/analyzers

    - name: Run Gitleaks secret scan
      uses: gitleaks/gitleaks-action@...

    - name: Lint Dockerfile
      run: docker run --rm -i hadolint/hadolint < Dockerfile
This is the first trust gate. It answers a basic question before the pipeline spends more runner time: is this branch clean enough to deserve the heavier jobs? Format, style, analyzers, secret scanning, and Dockerfile linting are all cheap compared to deeper security analysis and deployment.
Why this matters in DevSecOps:
- formatting and style keep code review noise low so security-relevant changes stand out
- analyzer failures often catch risky API usage before scanners do
- Gitleaks catches credential leaks before artifacts are built or pushed
- Hadolint catches container hardening mistakes early, such as weak base-image practices or unsafe Dockerfile patterns
- fail-fast gates keep expensive security jobs focused on branches that already meet minimum engineering discipline
Why separate format, style, and analyzers instead of one dotnet build?
- formatting drift has different fix path than compiler or analyzer failures
- logs stay narrow
- teams can tighten one policy without changing all others
- reusable composite actions stay simple and local to repository
Stage 2: IaC and pipeline misconfiguration scan
sast-iac-checkov covers the gap between code SAST and package SCA. It looks at the workflow and Docker build surfaces themselves.
In this sample I used Checkov for:
- GitHub Actions hardening checks
- Dockerfile checks
- secrets-style policy rules
sast-iac-checkov:
  permissions:
    contents: read
    security-events: write
  needs: [quality-check]
  steps:
    - name: Prepare Checkov artifacts
      uses: ./.github/actions/prepare-directories

    - name: Run Checkov IaC scan
      id: checkov
      continue-on-error: true
      uses: bridgecrewio/checkov-action@...
      with:
        directory: .
        framework: github_actions,dockerfile,secrets
        quiet: true
        output_format: cli,sarif
        output_file_path: console,artifacts/security/checkov.sarif

    - name: Upload Checkov SARIF
      if: always()
      uses: ./.github/actions/upload-sarif
      with:
        sarif-file: artifacts/security/checkov.sarif
        category: checkov

    - name: Fail on Checkov findings
      if: steps.checkov.outcome == 'failure'
      run: |
        echo "::error::Checkov found IaC or pipeline misconfigurations."
        exit 1
This stage treats pipeline and container build files as production code. That matters because a secure application can still be shipped through an insecure workflow. Checkov covers the security posture of the delivery system itself.
Why this matters in DevSecOps:
- GitHub Actions files can introduce over-broad permissions, unsafe triggers, or weak secret handling
- Dockerfiles can encode bad defaults that app scanners will never see clearly
- IaC-style checks move operational security left instead of waiting for cloud runtime review
- SARIF upload pushes these findings into same GitHub Security experience developers already use for code scanning
Checkov runs after quality gate, but before build and test. Reason: misconfigured workflow or risky Dockerfile should block pipeline even if application compiles fine. The current workflow also separates SARIF upload from fail logic, so findings can still land in GitHub Security even when the job ends as failed.
That upload-sarif helper is intentionally tiny:
runs:
  using: composite
  steps:
    - name: Upload SARIF report
      uses: github/codeql-action/upload-sarif@...
      with:
        sarif_file: ${{ inputs.sarif-file }}
        category: ${{ inputs.category }}
So the local action is not adding hidden behavior. It simply standardizes the call shape and keeps all SARIF uploads consistent across Checkov, Trivy, Grype, Semgrep, and optional Snyk.
Stage 3: SAST with Semgrep, CodeQL, and optional Sonar
Static analysis stays split into parallel jobs.
sast-semgrepgives fast broad coveragesast-codeqlgives deeper semantic analysis for C#sast-sonaradds optional quality-gate and security-hotspot analysis when Sonar secrets are configured and Sonar CI is enabled for the run
Semgrep excerpt:
- name: Run Semgrep SAST
  run: |
    docker run --rm \
      -v "$PWD:/src" \
      -w /src \
      semgrep/semgrep:latest \
      semgrep scan \
      --config p/security-audit \
      --error \
      --metrics=off \
      --exclude .git \
      --exclude artifacts \
      --exclude tests \
      --sarif \
      --output artifacts/security/semgrep.sarif \
      .
This gives you fast, pattern-based SAST coverage. It is useful for catching dangerous coding patterns, insecure defaults, and suspicious constructs without waiting for slower semantic analysis.
Why this matters in DevSecOps:
- fast checks preserve developer feedback speed
- Semgrep often catches broad cross-language patterns, not only compiler-visible defects
- containerized execution keeps runner setup simple and reproducible
- pinned scan policy such as
p/security-auditkeeps the lane intentionally security-focused instead of acting like generic lint - SARIF output means findings become actionable in repository security workflows, not buried in raw logs
CodeQL excerpt:
- name: Initialize CodeQL
  uses: github/codeql-action/init@...
  with:
    languages: csharp
    build-mode: manual
    queries: security-and-quality

- name: Build solution for CodeQL
  uses: ./.github/actions/build

- name: Analyze with CodeQL
  uses: github/codeql-action/analyze@...
  with:
    category: /language:csharp
This adds semantic SAST. Unlike pattern scanning alone, CodeQL understands code flow, library usage, and language structure more deeply.
Why this matters in DevSecOps:
- it helps find higher-value issues such as injection paths, tainted data flow, and dangerous framework usage
- it produces GitHub-native code scanning results that integrate well with repository security views
- manual build mode makes scan reflect actual compiled code path instead of shallow source-only guess
- pairing CodeQL with Semgrep balances depth and speed instead of over-trusting single scanner
Why both?
- Semgrep is fast and easy to gate
- CodeQL gives stronger language-aware analysis
- separate jobs run in parallel and produce clearer ownership when one fails
Sonar excerpt:
sast-sonar:
  needs: [quality-check]
  steps:
    - name: Set up JDK
      uses: actions/setup-java@...
      with:
        distribution: temurin
        java-version: '17'

    - name: Setup .NET Core
      uses: actions/setup-dotnet@...
      with:
        global-json-file: global.json

    - name: Restore local tools
      run: dotnet tool restore

    - name: Configure Husky
      run: dotnet husky install

    - name: Restore solution
      env:
        SOLUTION_PATH: DevSecOpsPipelineSample.slnx
      run: dotnet tool run husky -- run --name setup-solution-restore

    - name: Setup SonarQube Scanner
      uses: ./.github/actions/sonar-scanner-setup

    - name: Resolve Sonar configuration
      env:
        SONAR_CI_ENABLED: ${{ github.event_name == 'workflow_dispatch' && (inputs.sonar_enabled && 'true' || 'false') || vars.SONAR_CI_ENABLED || 'true' }}
      run: |
        if [[ -z "${SONAR_TOKEN}" ]]; then
          echo "enabled=false" >> "$GITHUB_OUTPUT"
          exit 0
        fi
        if [[ "$(printf '%s' "${SONAR_CI_ENABLED:-true}" | tr '[:upper:]' '[:lower:]')" != "true" ]]; then
          echo "enabled=false" >> "$GITHUB_OUTPUT"
          exit 0
        fi
        echo "enabled=true" >> "$GITHUB_OUTPUT"

    - name: Sonarqube Begin
      if: steps.sonar_config.outputs.enabled == 'true'
      run: ./.sonar/scanner/dotnet-sonarscanner begin ...

    - name: Build
      if: steps.sonar_config.outputs.enabled == 'true'
      run: dotnet build DevSecOpsPipelineSample.slnx --configuration Release --no-restore

    - name: Test
      if: steps.sonar_config.outputs.enabled == 'true'
      env:
        TEST_RESULTS_DIRECTORY: TestResults/Sonar
        TEST_COVERAGE_OUTPUT_FORMAT: xml
        TEST_COVERAGE_OUTPUT: coverage.xml
        TEST_ADDITIONAL_COVERAGE_OUTPUT_FORMAT: ''
        TEST_ADDITIONAL_COVERAGE_OUTPUT: ''
        TEST_NO_BUILD: 'true'
      run: dotnet tool run husky -- run --name test

    - name: Sonarqube End
      if: always() && steps.sonar_config.outputs.enabled == 'true'
      run: ./.sonar/scanner/dotnet-sonarscanner end ...
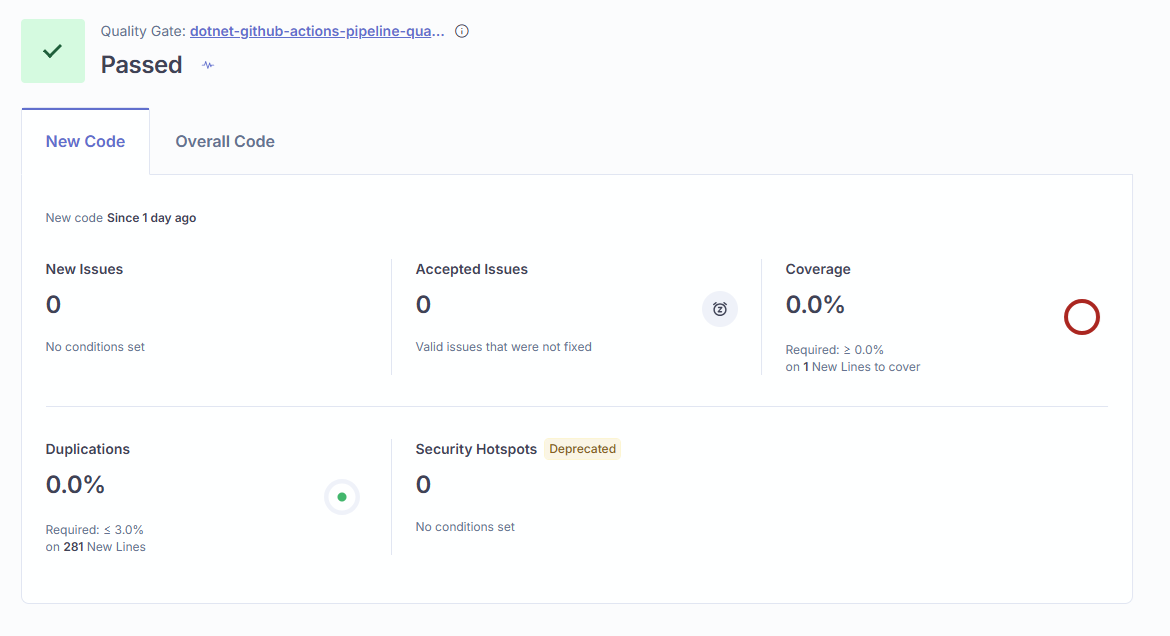
This gives you a Sonar lane without turning Sonar into a hard dependency for every clone of the sample. If the Sonar secrets are missing, or if Sonar CI is disabled for a manual run through the sonar_enabled dispatch input or SONAR_CI_ENABLED variable, the job exits cleanly and the rest of the pipeline still works.
One detail is easy to miss if you only look at the begin command. begin does not do the full scan by itself. It prepares scanner state and injects Sonar targets. The real local analysis starts during dotnet build on the CI runner. After that, the Husky-backed test step produces .trx and XML coverage files for import, and end uploads the collected analysis so SonarCloud or SonarQube can finish processing and compute the quality gate.
Why this matters in DevSecOps:
- some teams already govern code health and release readiness through Sonar quality gates
- Sonar adds broader code quality, maintainability, and security-hotspot visibility around same build
- running it in parallel preserves overall pipeline shape instead of serializing all static analysis behind one tool
- keeping it optional avoids forcing external platform dependency into base sample
- the current workflow explicitly waits for the Sonar quality gate result, so branch or PR coverage thresholds can still block the Sonar lane when enabled
- using the repo's Husky test task for Sonar keeps local and CI test invocation aligned while still allowing Sonar-specific coverage settings
- explicit configuration validation catches missing
SONAR_PROJECT_KEYorSONAR_ORGANIZATIONearly instead of failing later in a less obvious scanner step
Why not replace CodeQL and Semgrep with Sonar?
- Sonar is broader than pure SAST and serves different governance purpose
- CodeQL remains stronger for GitHub-native semantic security analysis
- Semgrep remains cheaper and faster for broad blocking checks
- using Sonar as additional lane gives better layered analysis than picking only one engine
One orchestration detail changed in the current sample: dotnet-build-test runs after the blocking static-analysis jobs sast-iac-checkov, sast-semgrep, and sast-codeql, but not after sast-sonar. Sonar stays in parallel and gets enforced later by security-gate. That is a better trade in practice. Developers get compile and test feedback sooner, but Sonar still counts before release.
Stage 4: build and test
This job compiles and tests after quality, IaC, Semgrep, and CodeQL passed. Sonar intentionally stays parallel so developers get functional feedback sooner.
dotnet-build-test:
  needs:
    - quality-check
    - sast-iac-checkov
    - sast-semgrep
    - sast-codeql
  steps:
    - name: Build solution
      uses: ./.github/actions/build

    - name: Test solution
      uses: ./.github/actions/test
      with:
        test-filter-queries: |
          /[TestSuite=Unit]
          /[TestSuite=EndToEnd]
        no-build: true
        skip-setup: true
        generate-coverage-report: true
        publish-coverage-summary: true
        upload-coverage-artifact: true
        upload-test-artifact: true
        upload-coveralls: true
This stage proves the application still works after the early policy gates pass. That sounds obvious, but it is easy to lose sight of when a pipeline gets security-heavy. DevSecOps still has to deliver working software.
This is more than a bare dotnet test step. The shared test action delegates to the repo's Husky test task, which calls a small shell script around dotnet test. That script now runs two solution-level passes filtered by xUnit v3 traits, one for Unit and one for EndToEnd, then standardizes Microsoft Testing Platform coverage collection, writes native .coverage output, optionally converts it to Cobertura through dotnet-coverage, and lets CI decide whether to generate HTML, Markdown, and lcov reports or upload coverage to Coveralls.
Why this matters in DevSecOps:
- secure pipeline that ships broken app is still failed delivery system
- test artifacts create audit trail for what was validated before release
- native Microsoft Testing Platform coverage plus converted Cobertura keeps one test run usable for both .NET-native tooling and external coverage/reporting tools
- Coveralls adds historical coverage visibility and lightweight PR feedback without changing the local test path
- coverage output helps teams reason about how much of changed code had executable verification
- gating later security stages on successful build and test avoids mixing functional failures with vulnerability triage
That is deliberate. If tests fail, there is no reason to pay for app SCA, image SCA, signing, or deployment.
Stage 5: application SCA, SBOM, and GitHub Security uploads
This job scans the application surface, not the final container surface.
In workflow dependency order, dotnet-app-sca-security runs right after dotnet-build-test. image-build starts after that, and image-sca-security follows the produced image artifact.
Important implementation details:
- app is first published into
artifacts/publish - CycloneDX generates app SBOM from solution graph
- trusted non-PR runs sign app SBOM as detached Sigstore bundle and verify it immediately
- Trivy scans filesystem and configuration
- Grype scans published output
- optional Snyk overlay runs only when
SNYK_TOKENexists - SARIF goes into GitHub Security tab
- SBOM can be pushed into Dependency-Track
- name: Publish app for scan surface
  run: >-
    dotnet publish src/DevSecOpsPipelineSample.Api/DevSecOpsPipelineSample.Api.csproj
    -c Release
    -o artifacts/publish
    --no-restore

- name: Generate app SBOM
  run: >-
    dotnet tool run dotnet-CycloneDX DevSecOpsPipelineSample.slnx
    -o artifacts/sbom/app
    -j

- name: Sign app SBOM
  run: >-
    cosign sign-blob --yes
    --bundle artifacts/sbom/app/bom.sigstore.json
    artifacts/sbom/app/bom.json

- name: Verify app SBOM signature
  run: >-
    cosign verify-blob
    --bundle artifacts/sbom/app/bom.sigstore.json
    --certificate-oidc-issuer https://token.actions.githubusercontent.com
    artifacts/sbom/app/bom.json

- name: Run Trivy app scan JSON
  uses: aquasecurity/trivy-action@...
  with:
    scan-type: fs
    scan-ref: .
    scanners: vuln,secret,misconfig
    format: json
    output: artifacts/security/trivy-app.json
    severity: ${{ env.TRIVY_FAIL_SEVERITY }}
    exit-code: '1'

- name: Run Snyk app scan
  env:
    SNYK_TOKEN: ${{ secrets.SNYK_TOKEN }}
  run: |
    snyk test \
      --file=src/DevSecOpsPipelineSample.Api/DevSecOpsPipelineSample.Api.csproj \
      --severity-threshold=high \
      --sarif-file-output=artifacts/security/snyk-app.sarif
Signing the SBOM matters because the SBOM is itself a release artifact. It may be uploaded to Dependency-Track, shared with auditors, or used later during incident response. Without a signature, anyone who can modify the SBOM file can silently change the dependency inventory. A detached Sigstore bundle proves the SBOM came from the trusted CI workload and has not been tampered with after generation.
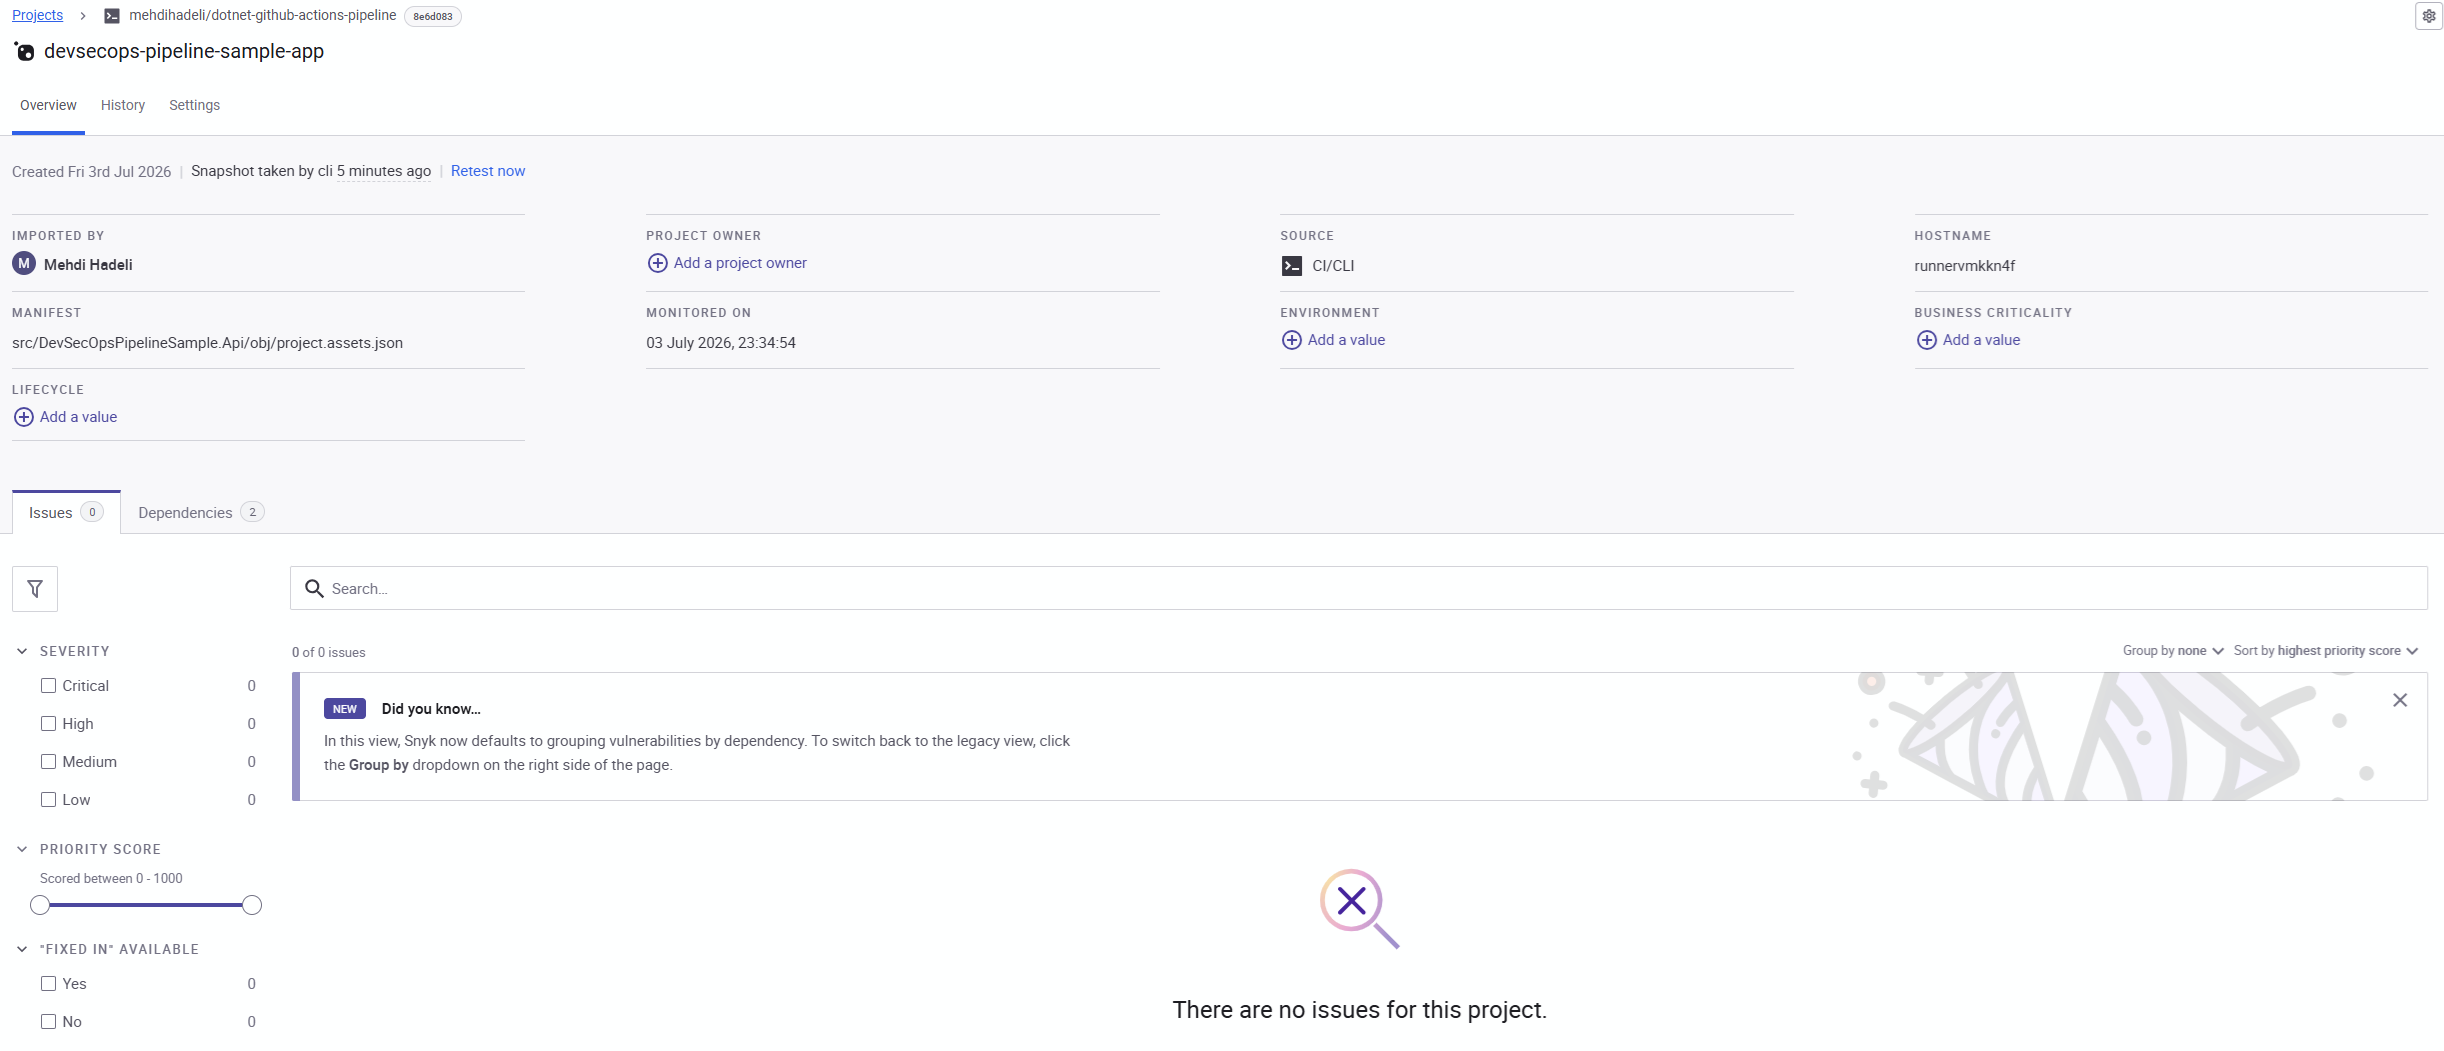
This is the application-side SCA flow. dotnet publish creates realistic application output, CycloneDX captures dependency inventory, trusted runs sign and verify the detached SBOM bundle, Trivy scans both source and published context, Grype adds a second package view over published output, and optional Snyk adds managed vulnerability intelligence.
Why this matters in DevSecOps:
- published output is closer to what ships than raw source tree alone
- SBOM gives durable inventory, not only point-in-time scan result
- detached bundle signing keeps
bom.jsonusable for Dependency-Track while still adding verifiable provenance - Trivy covers vulnerabilities, secrets, and misconfigurations in one pass
- Snyk overlay is useful for teams that want managed policies or additional advisory coverage
- application-layer scanning finds issues in project dependencies before they are hidden inside container context
Why keep app SCA separate from image SCA?
- app job is best place for NuGet and source-config view
- image job is best place for base OS and runtime-layer view
- findings remain easier to classify in GitHub Security
- two SBOMs stay independently useful in Dependency-Track
The sample does not stop at generating BOM files. It also uploads both of them when Dependency-Track credentials are configured.
Exact CI locations:
- app BOM upload:
dotnet-app-sca-security -> Upload app SBOM to Dependency-Track - image BOM upload:
image-sca-security -> Upload image SBOM to Dependency-Track
Both jobs call the same reusable action:
uses: ./.github/actions/upload-dependency-track-bom
with:
  dependency-track-url: ${{ secrets.DEPENDENCY_TRACK_URL }}
  dependency-track-api-key: ${{ secrets.DEPENDENCY_TRACK_API_KEY }}
App upload payload:
bom-file: artifacts/sbom/app/bom.json
project-name: ${{ env.APP_SBOM_PROJECT_NAME }}
project-version: ${{ steps.version_meta.outputs.build_version }}
Image upload payload:
bom-file: artifacts/sbom/image/image.cdx.json
project-name: ${{ env.APP_SBOM_PROJECT_NAME }}-image
project-version: ${{ needs.image-build.outputs.build-version }}
That is an important current detail. Dependency-Track no longer sees an always-raw full SHA as the project version. It now receives the same shared build version the rest of the pipeline uses: git tag for tagged builds, otherwise short SHA.
If you want to inspect those SBOMs in a local governance stack, the sample repository now also includes a ready-to-run Dependency-Track environment with PostgreSQL and a Trivy server:
- compose file: deployments/dependency-track/docker-compose.yml
- setup notes: deployments/dependency-track/README.md
- env template: deployments/dependency-track/.env.example
- bootstrap script: deployments/dependency-track/bootstrap-trivy.sh
The Trivy part matters because Dependency-Track's Trivy datasource works in client/server mode. In this sample stack, Dependency-Track runs as one container, Trivy runs as another, and the analyzer is configured to use http://trivy:8080 on the internal Docker Compose network.
There are now two setup paths:
- manual UI setup in
Administration -> Analyzers -> Trivy - optional API bootstrap through
deployments/dependency-track/bootstrap-trivy.sh
version: '3.9'

services:
  dtrack-apiserver:
    image: dependencytrack/apiserver:latest
    depends_on:
      postgres-db:
        condition: service_healthy
      trivy:
        condition: service_started

  dtrack-frontend:
    image: dependencytrack/frontend:latest

  trivy:
    image: aquasec/trivy:latest
    command:
      - server
      - --listen
      - 0.0.0.0:8080
      - --token
      - ${TRIVY_SERVER_TOKEN}

  dtrack-bootstrap:
    image: curlimages/curl:8.14.1
    environment:
      DT_API_BASE_URL: http://dtrack-apiserver:8080
      TRIVY_BASE_URL: http://trivy:8080

  postgres-db:
    image: postgres:16
If you provide DEPENDENCY_TRACK_API_KEY in .env, the bootstrap container waits for http://dtrack-apiserver:8080/api/openapi.json and http://trivy:8080/healthz, then posts the Trivy analyzer settings to POST /api/v1/configProperty/aggregate.
That bootstrap configures these exact Dependency-Track properties:
scanner.trivy.enabled=truescanner.trivy.base.url=http://trivy:8080scanner.trivy.api.token=${TRIVY_SERVER_TOKEN}scanner.trivy.ignore.unfixed=${TRIVY_IGNORE_UNFIXED}
If you prefer UI configuration, enable the Trivy analyzer in Administration -> Analyzers -> Trivy, set Base URL to http://trivy:8080, and use the same token value you placed in .env as TRIVY_SERVER_TOKEN.
Warm up Dependency-Track with app and image SBOMs
Before wiring the full GitHub Actions upload path to a reachable Dependency-Track instance, it is useful to warm up the local stack with the exact two BOM shapes produced by CI.
Use the same kebab-case project names CI uses when it uploads SBOMs automatically:
devsecops-pipeline-sampledevsecops-pipeline-sample-image
Use the same shared build version CI uses: git tag for tagged builds, otherwise short SHA.
If you want to upload them through the UI:
- open
http://localhost:8080 - create or open the target project
- click
Upload BOM - upload
bom.jsontodevsecops-pipeline-sample - upload
image.cdx.jsontodevsecops-pipeline-sample-image
If you want to upload them through the local API instead, use the same endpoint the reusable action ultimately targets:
curl -fsS -X POST "http://localhost:8081/api/v1/bom" \
  -H "X-Api-Key: YOUR_API_KEY" \
  -F "autoCreate=true" \
  -F "projectName=devsecops-pipeline-sample" \
  -F "projectVersion=BUILD_VERSION" \
  -F "bom=@path/to/bom.json"

curl -fsS -X POST "http://localhost:8081/api/v1/bom" \
  -H "X-Api-Key: YOUR_API_KEY" \
  -F "autoCreate=true" \
  -F "projectName=devsecops-pipeline-sample-image" \
  -F "projectVersion=BUILD_VERSION" \
  -F "bom=@path/to/image.cdx.json"
The best source for those files is the CI artifact produced by the Record and notify job and Upload CI evidence bundle step.
That gives you a tighter warmup loop:
- open a successful CI run
- download the artifact published by
Record and notify - extract it locally
- upload these exact files into your local Dependency-Track stack
Expected paths inside the downloaded artifact:
- app SBOM:
artifacts/sbom/app/bom.json - image SBOM:
artifacts/sbom/image/image.cdx.json
That is better than rebuilding locally when your goal is to validate the real pipeline output, because you are testing the exact BOM files generated by CI.
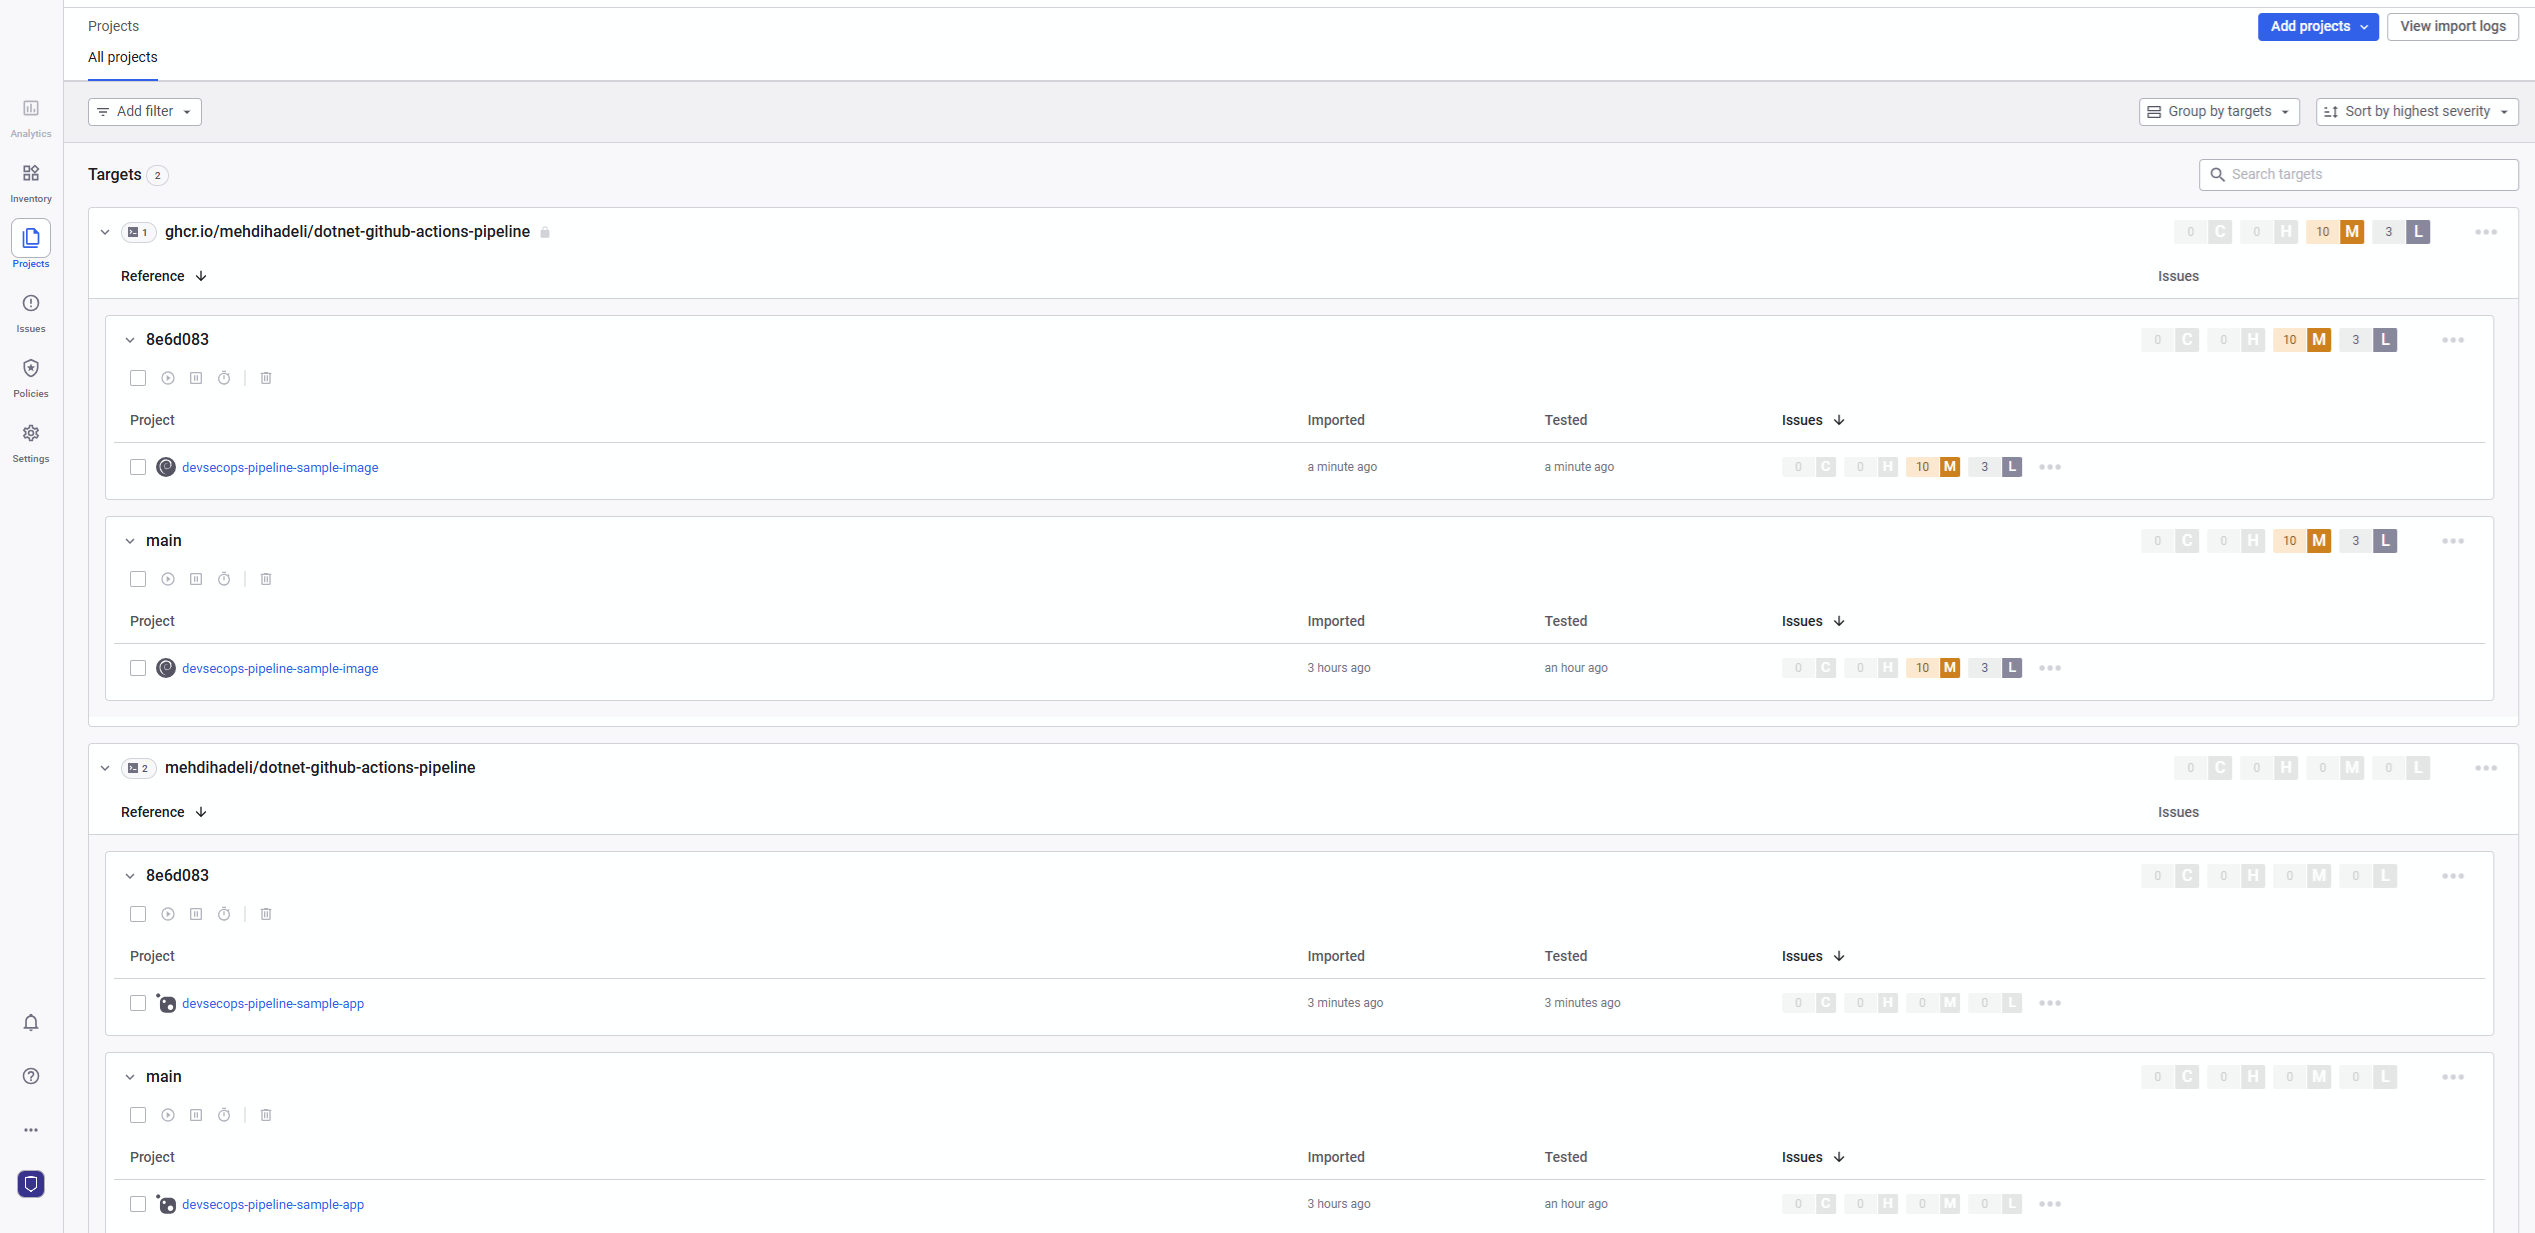
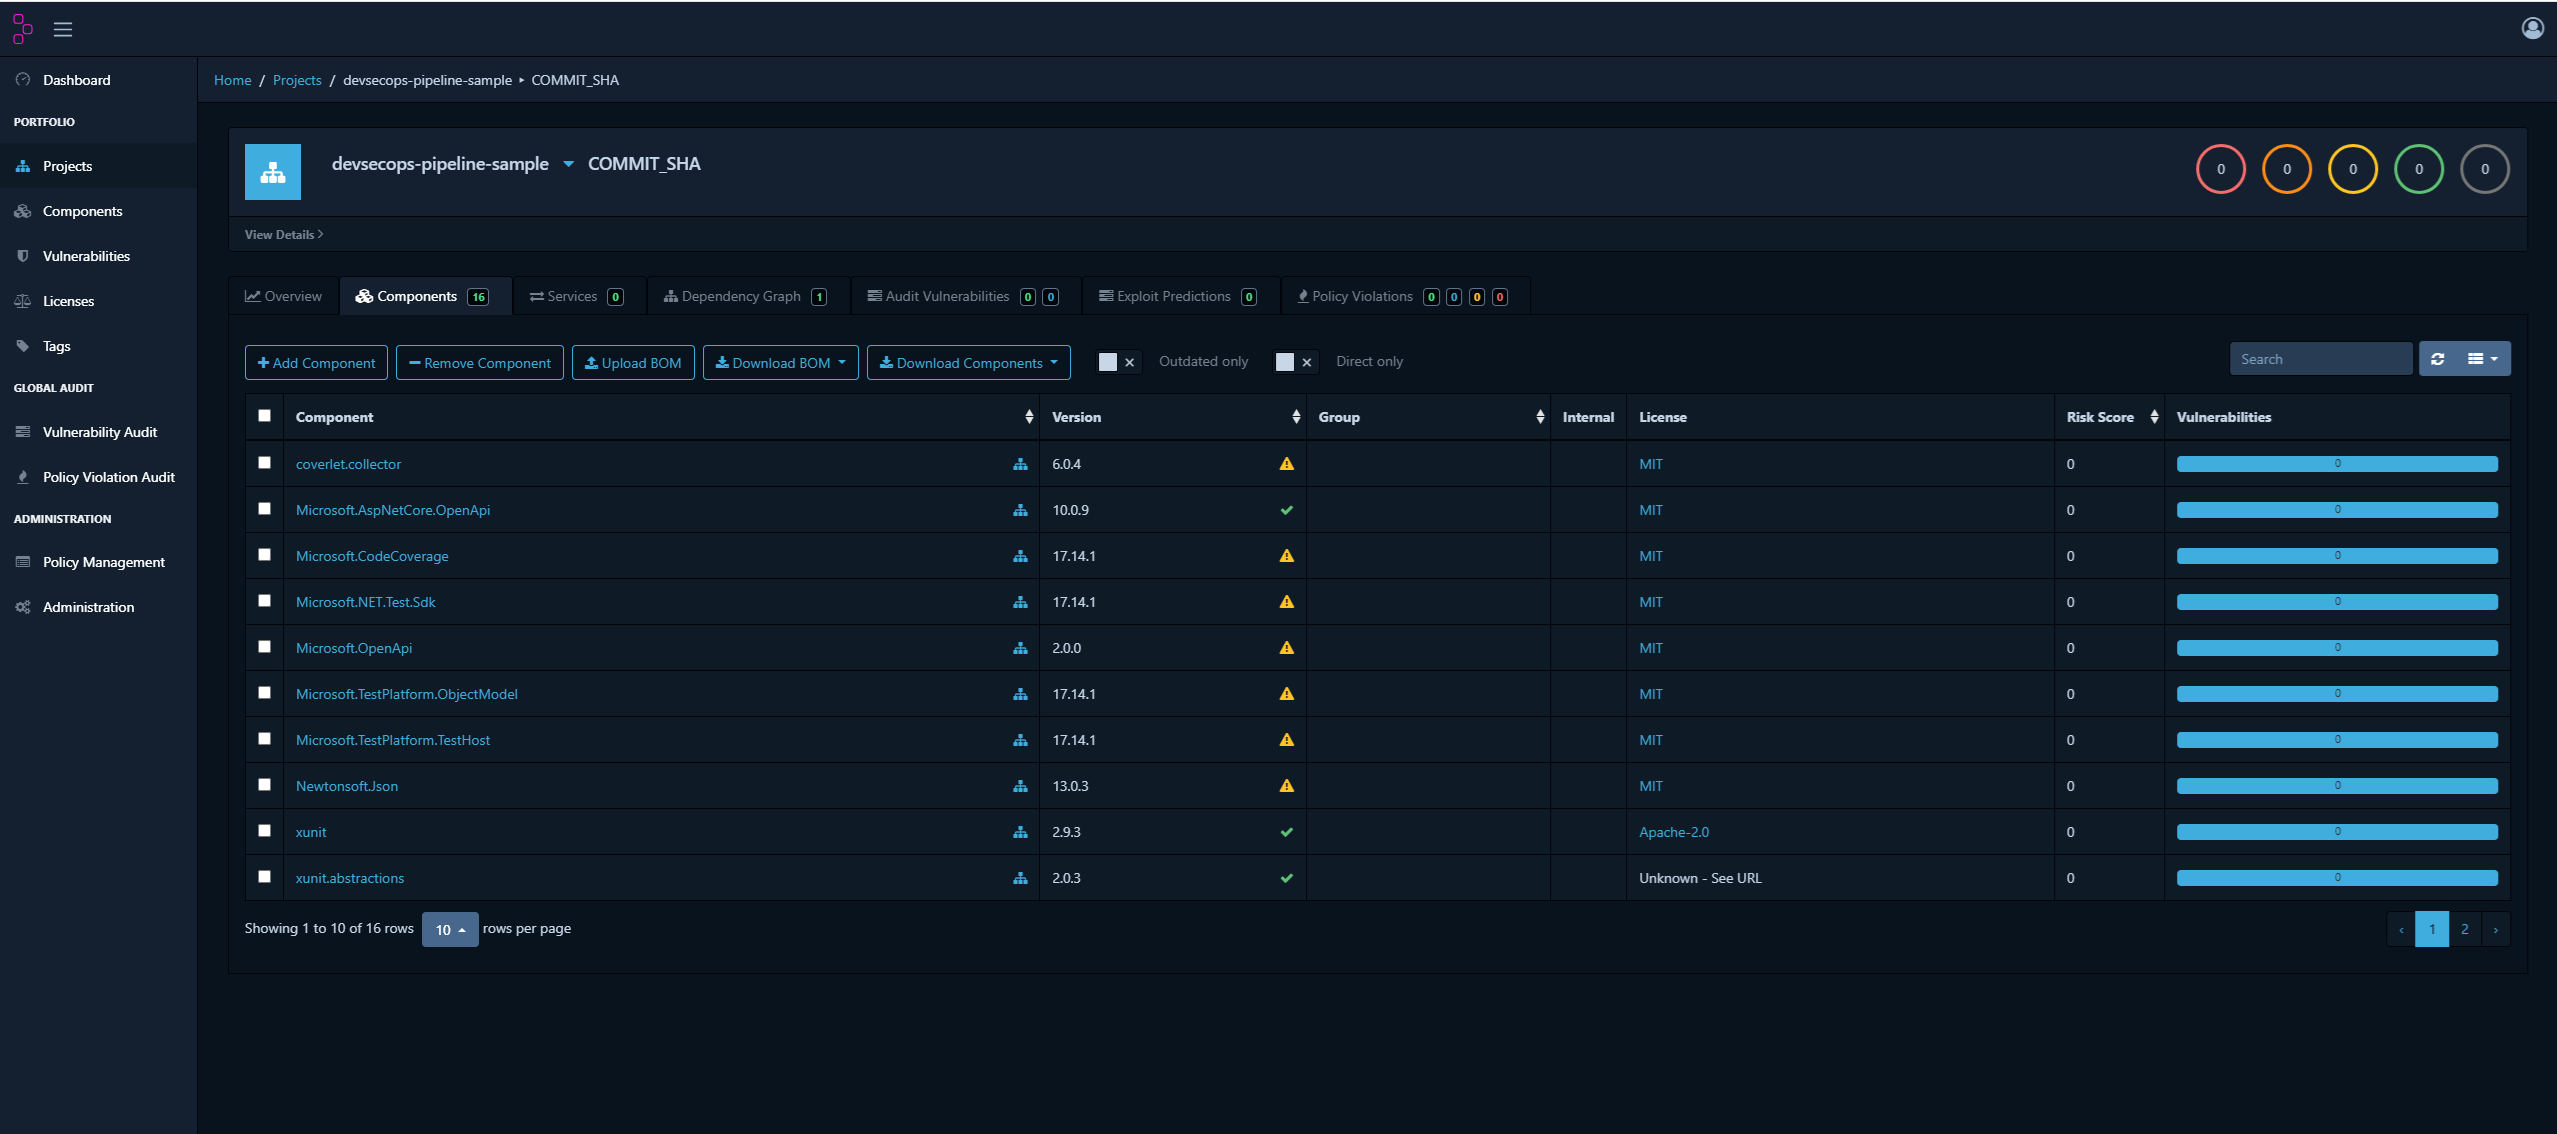
This is worth doing even if you plan to automate later, because it gives you a quick visual check that the app and image BOMs produce different project views.
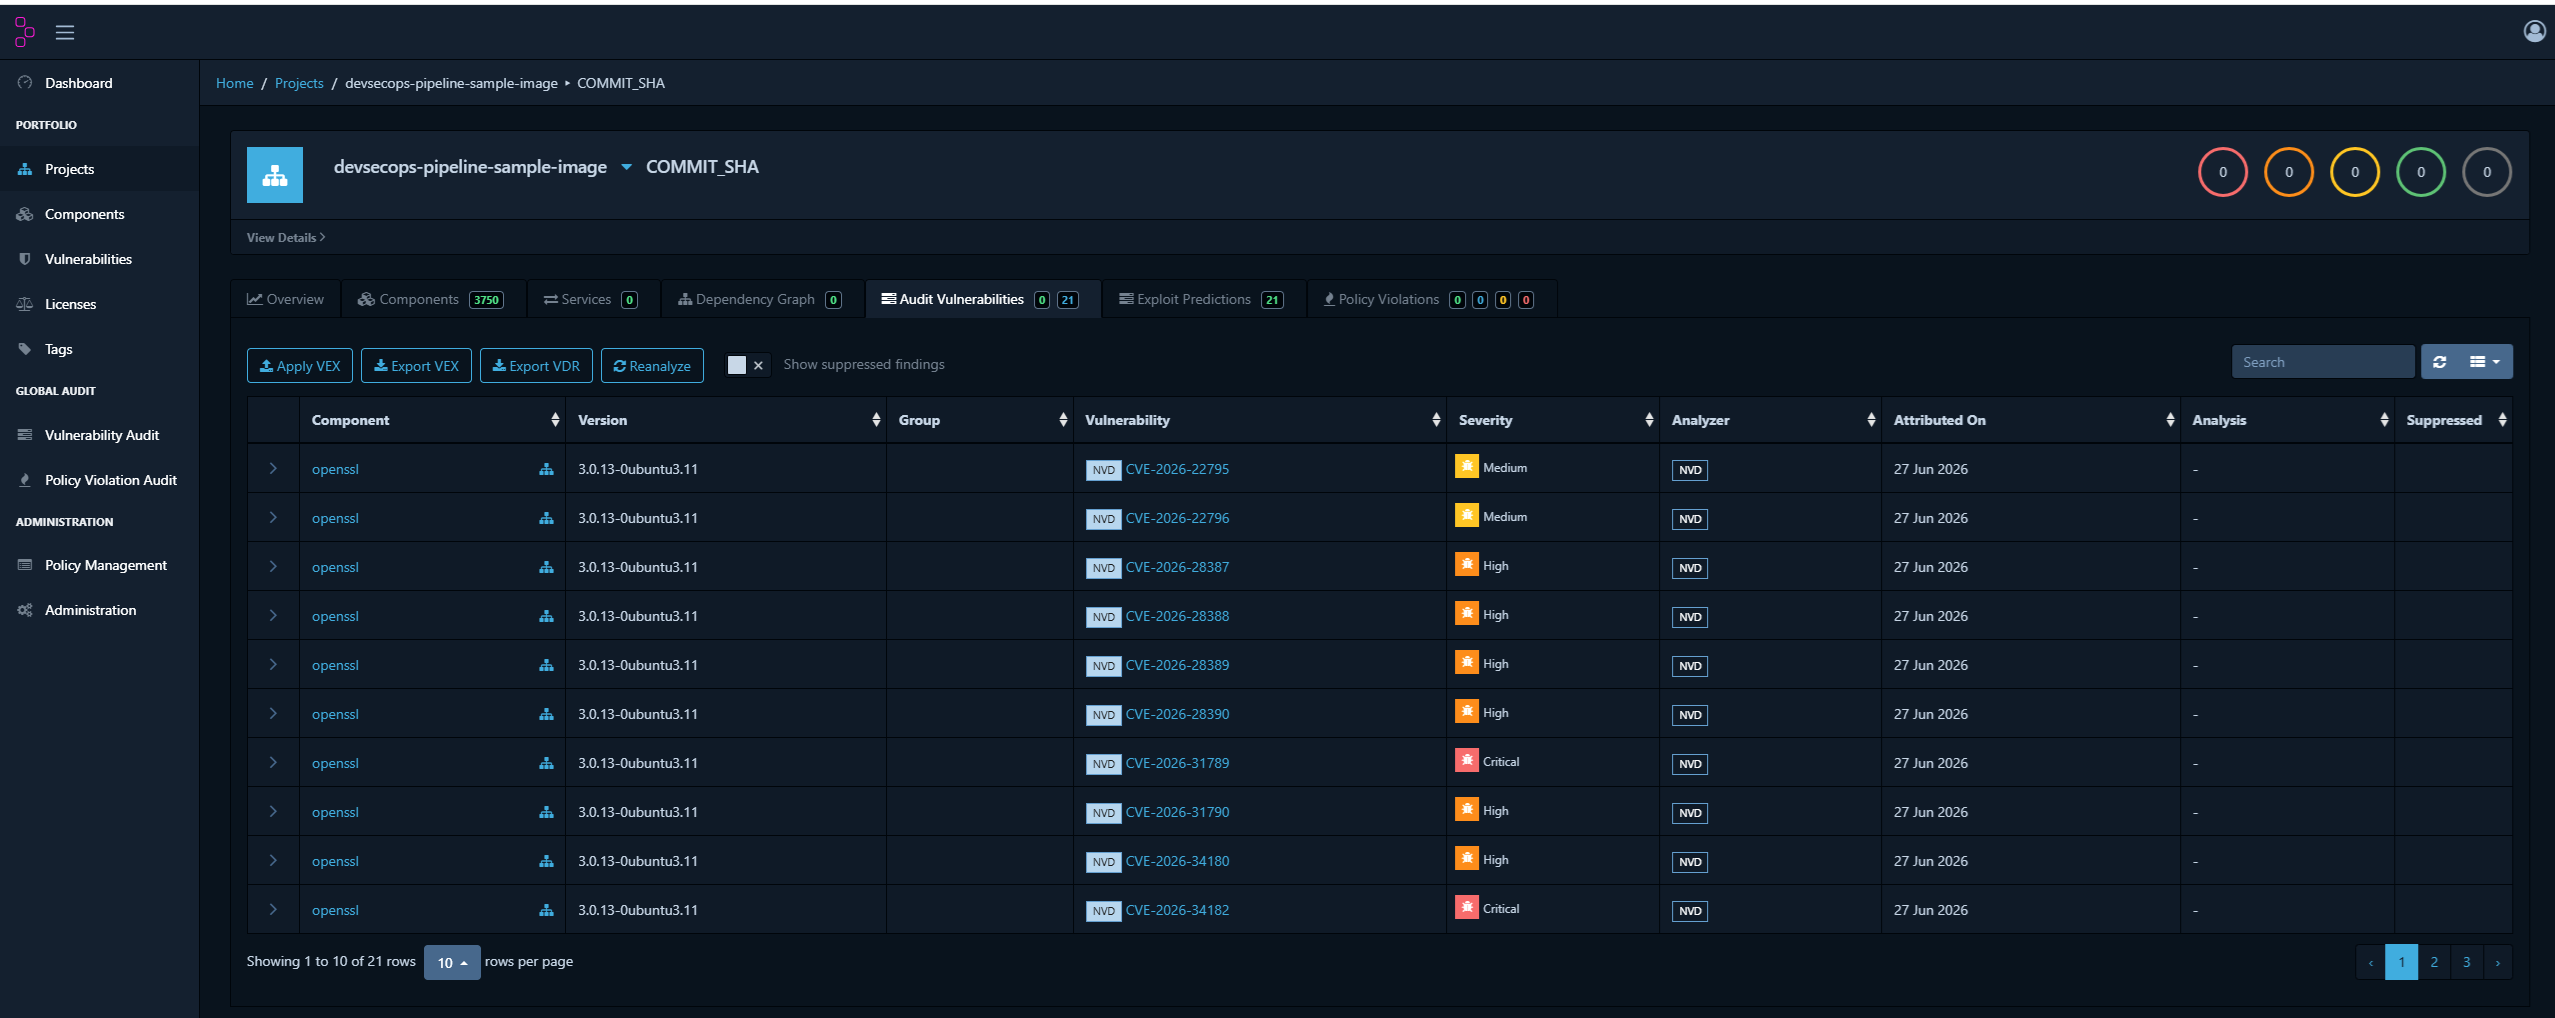
- the app project usually looks like a dependency inventory with far fewer CVEs
- the image project usually exposes many more OS and runtime package findings
- the difference becomes obvious in
Components,Vulnerabilities, andDependency Graph
That separation is exactly why this pipeline keeps app SBOM and image SBOM distinct instead of flattening everything into one upload.
The screenshots below show that split in practice. The application project mostly acts as a component inventory, while the image project is where runtime and OS package CVEs become much more visible.
When those SARIF uploads land successfully, GitHub surfaces them in the Security and quality tab under Code scanning. That gives the team one place to review Trivy, Grype, CodeQL, Semgrep, and other uploaded findings instead of hunting through raw workflow logs.
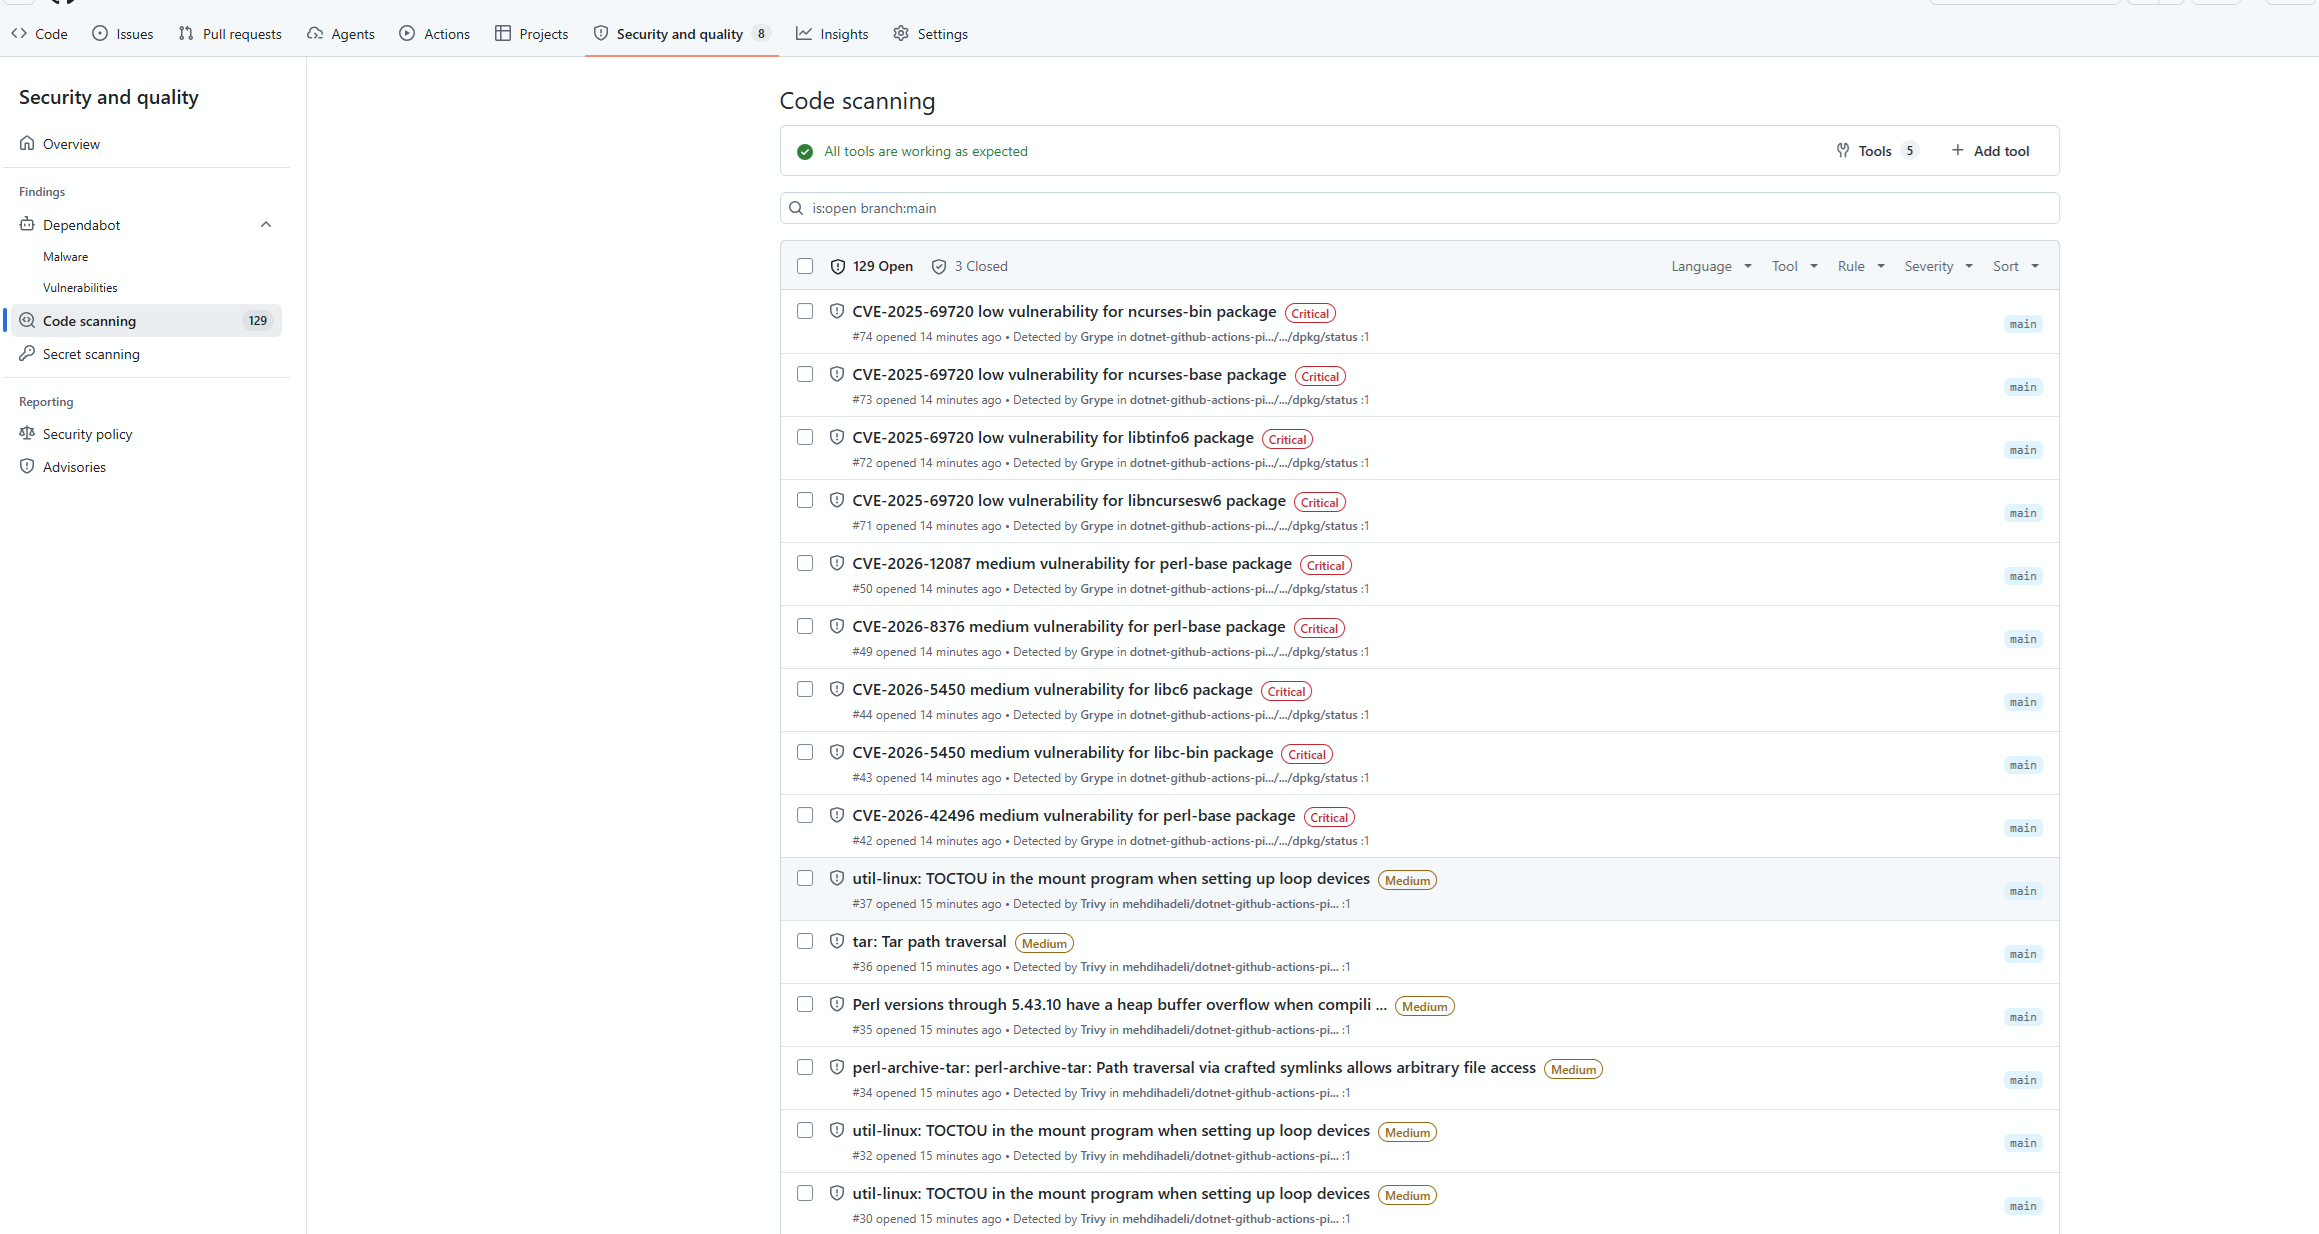
In this sample, that view is especially useful because multiple tools contribute findings for the same repository. GitHub keeps the alerts grouped by rule, severity, tool, and branch so engineers can triage CVEs and security issues from the pipeline in a single UI.
Stage 6: image build and image SCA
The container image gets built once for the scanning lane, exported as an artifact, and scanned in a separate job.
That pattern matters because it avoids rebuilding the scan target inside every security job. After the security gate passes, the workflow uses Docker's official publish actions to rebuild and push the release image with richer tags and labels.
image-build:
  needs:
    - dotnet-app-sca-security
  outputs:
    image-name: ${{ steps.meta.outputs.image_name }}
    image-ref: ${{ steps.meta.outputs.image_ref }}
    image-tag: ${{ steps.meta.outputs.image_tag }}
    build-version: ${{ steps.meta.outputs.build_version }}
  steps:
    - name: Resolve image and version metadata
      id: meta
      uses: ./.github/actions/resolve-version-metadata

    - name: Build container image
      run: docker build -t "${{ steps.meta.outputs.image_ref }}" .

    - name: Save container image artifact
      run: docker save "${{ steps.meta.outputs.image_ref }}" | gzip > "${IMAGE_TAR_PATH}"
This creates the scan target for downstream jobs. Instead of rebuilding the image repeatedly during image security analysis, the pipeline builds once, captures shared metadata through a dedicated action, and reuses the same artifact there.
Why this matters in DevSecOps:
- repeatable artifact handling reduces “it passed in one job but not another” drift inside the scanning lane
- downstream image scans inspect one fixed local image artifact
- saved image artifact keeps the image-SCA lane isolated from registry concerns
- normalized image naming avoids registry mismatches and case-sensitivity surprises in GHCR
One tradeoff changed in current sample. The publish job now rebuilds with docker/setup-buildx-action, docker/metadata-action, and docker/build-push-action instead of pushing the saved tarball directly. That gives a cleaner GHCR publish experience and better tag management, but it does mean strict byte-for-byte scan-to-publish identity is no longer guaranteed by the workflow alone.
Image security job then loads same artifact and scans it.
- name: Generate image SBOM
  uses: anchore/sbom-action@...
  with:
    image: ${{ needs.image-build.outputs.image-ref }}
    format: cyclonedx-json
    output-file: artifacts/sbom/image/image.cdx.json

- name: Run Trivy image scan JSON
  uses: aquasecurity/trivy-action@...
  with:
    image-ref: ${{ needs.image-build.outputs.image-ref }}
    scanners: vuln,secret,misconfig
    format: json
    output: artifacts/security/trivy-image.json
    severity: ${{ env.TRIVY_FAIL_SEVERITY }}
    exit-code: '1'

- name: Run Snyk image scan
  env:
    SNYK_TOKEN: ${{ secrets.SNYK_TOKEN }}
  run: |
    snyk container test "${{ needs.image-build.outputs.image-ref }}" \
      --severity-threshold=high \
      --sarif-file-output=artifacts/security/snyk-image.sarif
This covers the runtime artifact, not the project graph. The image SBOM and image scanners answer a different question: what is inside the final container that will actually execute in the environment?
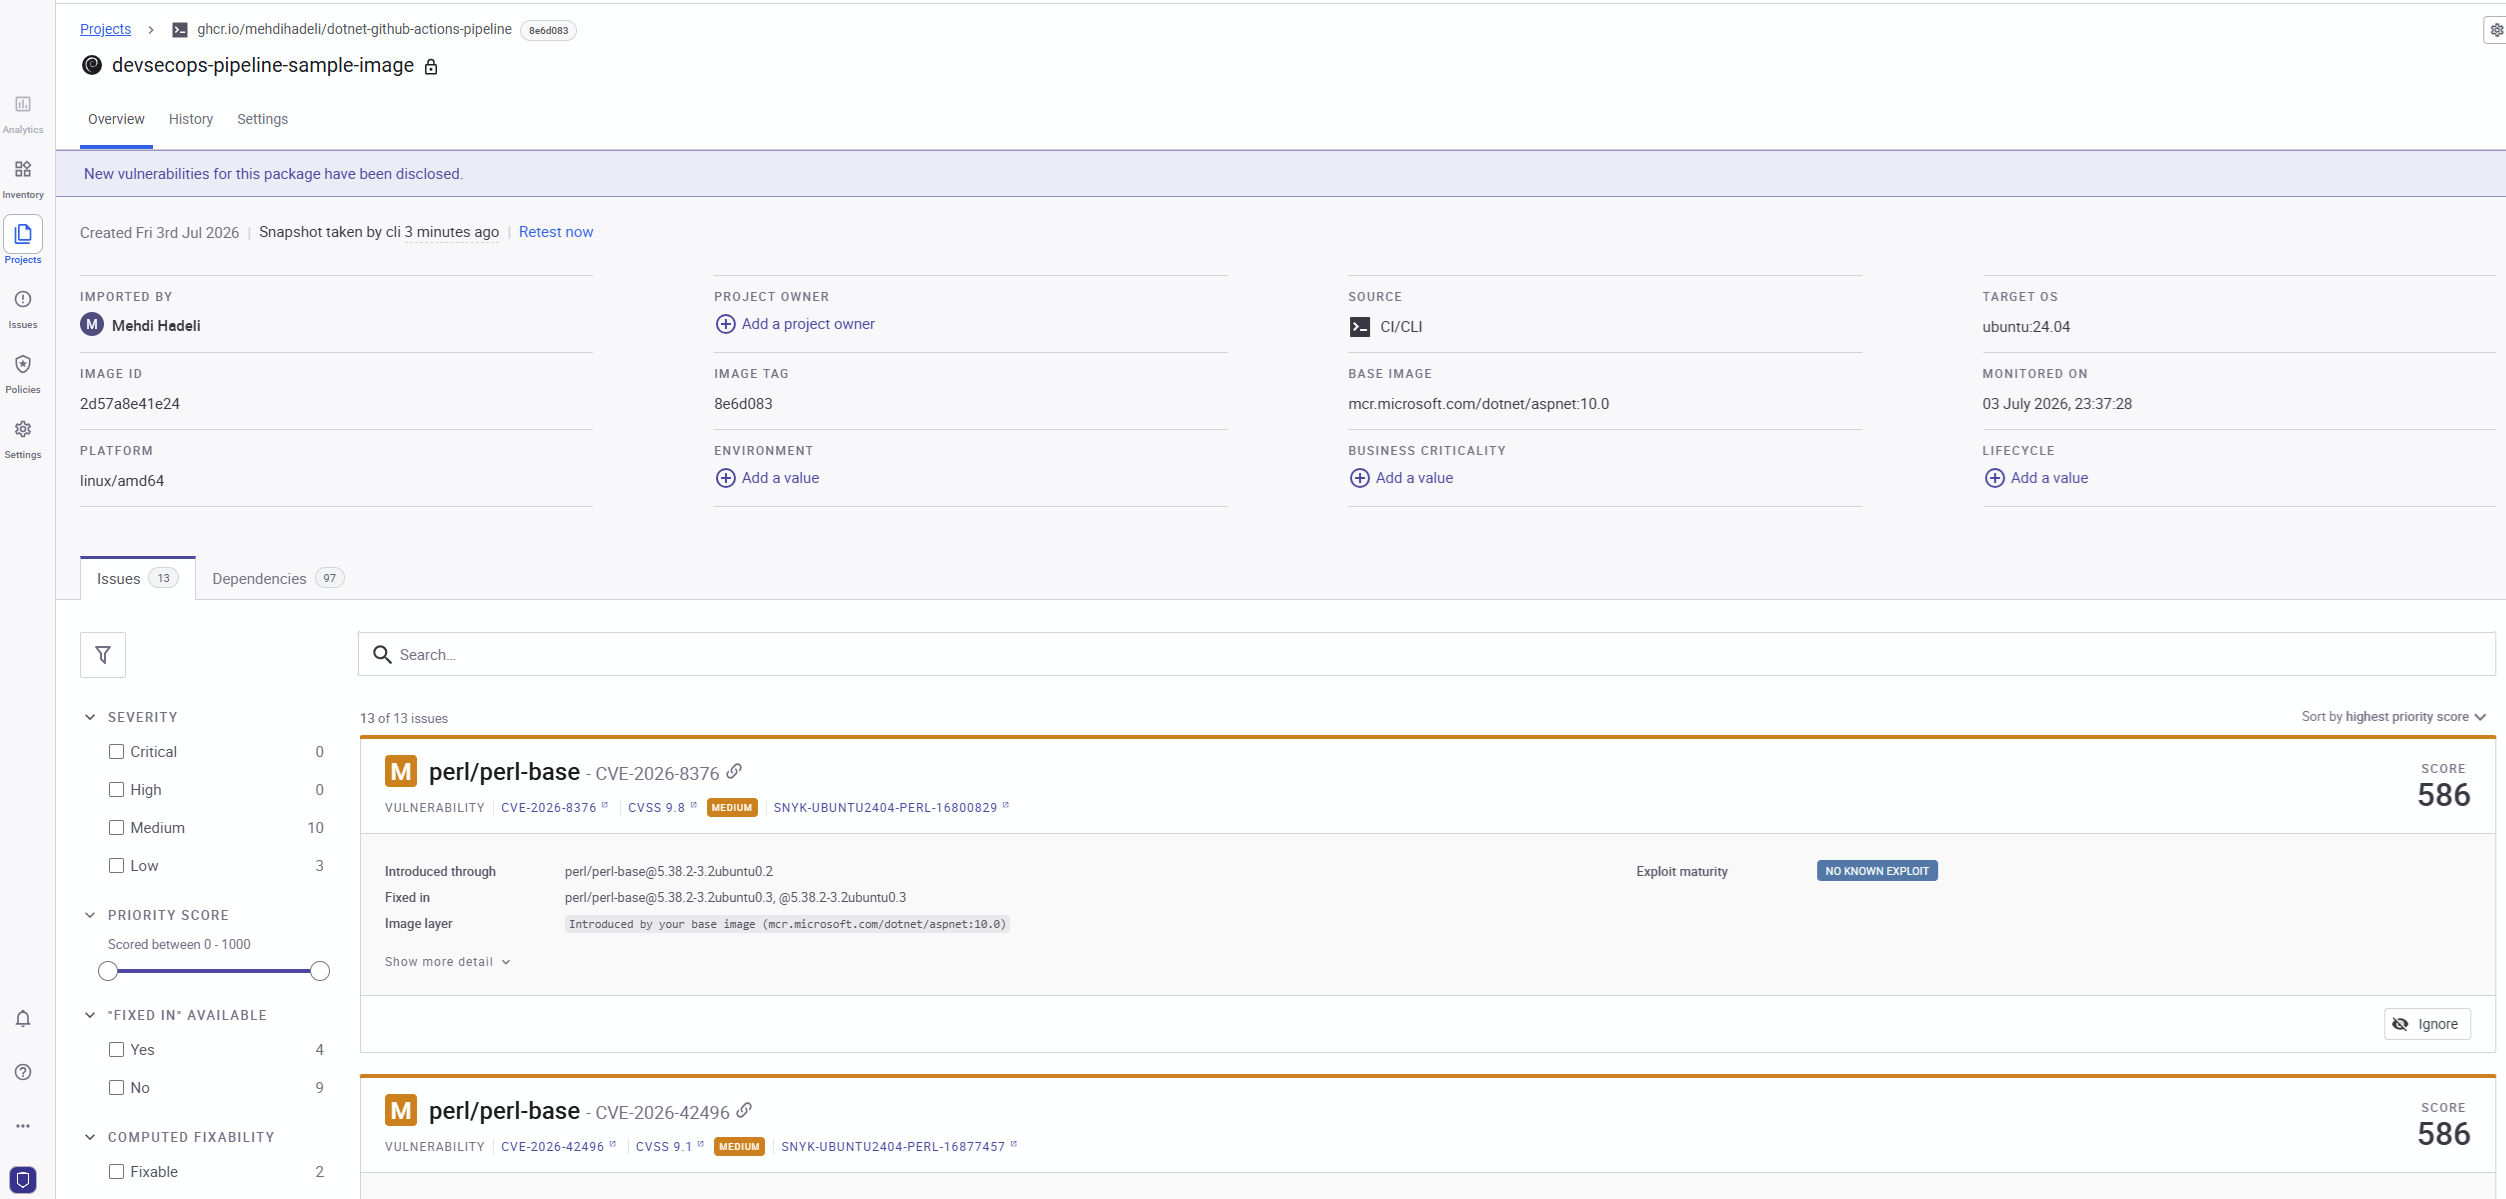
Why this matters in DevSecOps:
- base image packages and OS libraries do not show up clearly in app-level scanning
- container image may include extra runtime files, shells, package-manager remnants, or weak defaults
- image SBOM supports downstream governance and incident response when a base layer CVE appears later
- trusted non-PR runs sign and verify the image SBOM as detached bundle before publication stages continue
- blocking Trivy plus advisory Grype plus optional Snyk gives layered SCA view without forcing all tools to gate equally
Grype remains advisory second opinion in this sample. Trivy remains blocking primary image scanner. Snyk stays optional managed overlay.
One detail worth calling out: both app and image security jobs upload their artifacts even on failure by using if: always(). That makes post-failure triage much better because SBOMs, SARIF, and JSON evidence still survive when a gate blocks release.
Stage 7: security gate
This stage centralizes the release decision instead of leaving pass or fail logic scattered across several scanner jobs.
The workflow now evaluates Sonar, application security, and image security together, writes a gate report artifact, and only then allows image publication to continue.
security-gate:
  if: always()
  needs:
    - sast-sonar
    - dotnet-app-sca-security
    - image-sca-security
  outputs:
    gate-status: ${{ steps.evaluate.outputs.gate_status }}
It does not replace scanner failures. It turns them into one explicit policy checkpoint.
Why this matters in DevSecOps:
- release promotion now depends on one named policy decision, not only on reading several job results
- the gate produces durable audit output with Sonar result, app result, image result, commit, and run URL
- teams can later extend this stage with thresholds, waivers, or approval logic without redesigning whole pipeline
- one summary point makes troubleshooting easier when several scanners are involved
Cosign: what it is, and the two ways to sign
Before looking at the publish flow itself, it helps to separate the tool from the two signing models it supports. The sample uses the keyless model everywhere, but the comparison below explains why that is the right default for a GitHub Actions pipeline.
What Cosign is
Cosign is the container signing CLI from Sigstore, an open source project now sponsored by the OpenSSF. Sigstore's goal is to let developers securely build, distribute, and verify signed software artifacts. Cosign is the part of that stack that signs container images, blobs, and SBOMs, and it is the tool used throughout this sample for both detached app SBOM signing and image signing.
Why signing matters at all: a registry tag is mutable. dev or latest can be overwritten, and the bytes behind a tag can change between builds. A digest identifies exact content, but a digest alone does not prove who approved that content. A signature binds the digest to an identity, and verification then answers one question: did the identity this pipeline trusts actually sign this exact artifact?
Approach 1: key-based signing
The classic model. You generate a key pair, keep the private key secret, sign with it, and share the public key with everyone who needs to verify.
Generate a key pair locally:
cosign generate-key-pairThis creates cosign.key and cosign.pub, and the private key is encrypted with a password you provide either interactively or through COSIGN_PASSWORD.
Cosign supports several key backends, not only plain files:
- text-based keys in files, as shown above
- cloud KMS keys, such as Azure KeyVault, AWS KMS, or Google Cloud KMS
- hardware tokens
- Kubernetes secrets
You can even ask Cosign to write the keys into GitHub secrets directly:
cosign generate-key-pair github://OWNER/REPOThat creates COSIGN_PRIVATE_KEY, COSIGN_PUBLIC_KEY, and COSIGN_PASSWORD repository secrets, ready for the workflow to consume.
Signing inside a workflow then looks like this:
- name: Write signing key to disk
  shell: bash
  env:
    KEY: ${{ secrets.COSIGN_PRIVATE_KEY }}
  run: echo "$KEY" > cosign.key

- name: Sign the published Docker image
  env:
    COSIGN_PASSWORD: ${{ secrets.COSIGN_PASSWORD }}
  run: cosign sign --key cosign.key "$IMAGE_WITH_DIGEST"
Verification uses the public key:
cosign verify --key cosign.pub "$IMAGE_WITH_DIGEST"Cosign also supports key-value annotations on the signature, which is handy for embedding build context such as author, commit, or workflow run:
cosign sign --key cosign.key -a "author=CoderDave" "$IMAGE_WITH_DIGEST"The weakness of the file-based variant is the key-handling workaround itself: the private key lives in a secret, so the workflow has to write it to disk before signing. On GitHub-hosted runners that is acceptable because the runner is disposed when the job finishes, but on self-hosted runners it is a real exposure. Enterprise setups should keep private keys in a KMS such as Azure KeyVault, Hashicorp Vault, or AWS KMS and let Cosign read from there instead of from a file.
Approach 2: keyless signing
The modern model. No private key at all. Instead of provisioning and rotating keys, the signer obtains a short-lived certificate from Fulcio, a Sigstore root CA, using the OIDC token that GitHub Actions already provides. Rekor, the Sigstore transparency log, records the certificate and signature so the proof is public and tamper-evident.
Signing becomes a single command with no key material:
cosign sign --yes "$IMAGE_WITH_DIGEST"No --key, no COSIGN_PASSWORD, no key written to disk. The identity comes from the workflow itself: repository, ref, and workflow file.
Verification is where the trust boundary becomes explicit. Instead of sharing a public key, you verify the certificate identity:
cosign verify \
  --certificate-oidc-issuer "https://token.actions.githubusercontent.com" \
  --certificate-identity "https://github.com/$WORKFLOW_REF" \
  "$IMAGE_WITH_DIGEST"
The tradeoff: keyless signing publishes identity metadata, such as username, repository, and workflow name, to the public Rekor transparency log. That is the right behavior for public repositories, but wrong for private ones, and GitHub disables this by default for private repositories to prevent leaks.
Choosing between the two
| Key-based | Keyless | |
|---|---|---|
| Key material | private key plus password | none |
| Identity bound to | whoever holds the key | GitHub workflow identity (repo, ref, workflow) |
| Rotation | manual, easy to forget | automatic, short-lived certificates |
| Secret risk | key theft means anyone can sign | no key to steal |
| Transparency | no public log | Rekor public transparency log |
| Offline or air-gap | works | needs Fulcio and Rekor reachable |
| Best fit | air-gapped environments, non-GitHub CI, orgs that must hold their own keys | GitHub Actions pipelines and public images |
Why this matters in DevSecOps:
- key-based signing is only as strong as key custody, which is exactly the part pipelines tend to get wrong
- keyless removes the key-management attack surface entirely while producing a stronger claim: signed by this workflow, not merely by someone holding a key
- certificate identity verification pins the trust boundary to the exact workflow file and ref, so a signature from any other workflow or branch fails verification
- the Rekor transparency log turns signing into a public, auditable event instead of a private ceremony
- for a GitHub Actions pipeline, keyless is the better default; key-based remains the right answer for air-gapped environments, non-GitHub CI, and organizations that must hold their own signing keys
The sample follows the keyless model everywhere, from detached app SBOM bundles to the published image digest, and the keyless verification shown in the next stage is what makes the CI/CD trust handoff work.
Stage 8: CI publish, sign, verify, and attest
This is where CI stops being only validation and starts promoting artifacts.
Flow is:
- rebuild and publish release image to GHCR with Docker Buildx and Docker metadata tags
- attach image SBOM to published GHCR image as OCI evidence
- sign image with Cosign using the repo-local
sign-published-imagehelper - verify signature inside CI with the repo-local
verify-keyless-image-signaturehelper - generate provenance attestation in parallel from the signed image metadata
- rely on earlier jobs to sign and verify detached app and image SBOM bundles without mutating the SBOM JSON files
Because those are reusable actions, it is worth looking at the actual helper code instead of only the calling workflow.
The important release-policy change is in image tagging:
mainpushes publish short SHA tag plusdev,main, andlatest- git tag pushes publish the git tag value
- CI evidence records whether CD should auto-deploy and which environment it should target
Publish excerpt:
image-publish:
  needs:
    - security-gate
    - image-sca-security
  steps:
    - name: Set up Docker Buildx
      uses: docker/setup-buildx-action@...

    - name: Login to GitHub Container Registry
      uses: ./.github/actions/login-ghcr
      with:
        registry: ${{ env.REGISTRY }}
        username: ${{ github.actor }}
        password: ${{ secrets.GITHUB_TOKEN }}

    - name: Generate Docker metadata
      id: meta
      uses: docker/metadata-action@...
      with:
        images: ${{ env.REGISTRY }}/${{ needs.image-sca-security.outputs.image-name }}
        tags: |
          type=raw,value=${{ needs.image-sca-security.outputs.image-tag }}
          type=raw,value=dev,enable=${{ github.ref == 'refs/heads/main' }}
          type=raw,value=main,enable=${{ github.ref == 'refs/heads/main' }}
          type=raw,value=latest,enable=${{ github.ref == 'refs/heads/main' }}

    - name: Build and push Docker image
      id: build_and_push
      uses: docker/build-push-action@...
      with:
        context: .
        file: Dockerfile
        push: true
        tags: ${{ steps.meta.outputs.tags }}
        labels: ${{ steps.meta.outputs.labels }}
The login wrapper is also deliberately thin:
runs:
  using: composite
  steps:
    - name: Login to container registry
      uses: docker/login-action@...
      with:
        registry: ${{ inputs.registry }}
        username: ${{ inputs.username }}
        password: ${{ inputs.password }}
That helps article readers see that the repository is mostly standardizing repeated registry auth, not hiding custom publish behavior inside a large composite action.
This is the controlled promotion point. CI does not publish the image until image scanning has passed and the centralized security gate has reported PASS.
Why this matters in DevSecOps:
- registry should not become dumping ground for unreviewed artifacts
GITHUB_TOKENpluspackages: writeis enough for same-repository GHCR publishing, so workflow avoids separate long-lived registry secret- Docker metadata action gives one canonical tag plus convenience tags like
dev,main, andlatest - digest capture is critical because signing and attestation should bind to immutable content, not mutable tag alone
mainpushes without git tag still publish short SHA tag, and tag pushes publish the git tag itself
This is also where the current sample makes its biggest tradeoff. The publish job now rebuilds after the security gate so it can use Docker's standard GHCR actions and richer metadata tags. That is operationally cleaner, but less strict than pushing the already-scanned tarball directly.
The repository also contains a simpler local publish composite action for straightforward build-and-push cases, but the main CI workflow intentionally keeps the richer direct publish path because it needs Docker metadata labels, cache settings, digest capture, and multi-tag publication semantics.
Attestation is separate on purpose. After signing, the workflow fans out into two downstream jobs: verify-image-signature and attest. CI verification produces artifact evidence immediately, and CD repeats verification before deploy. Attestation produces GitHub-native provenance from the same signed digest.
Why keep signing, verification, and attestation separate?
- signing proves workload identity approved a digest
- verification turns that proof into release policy
- attestation adds structured provenance that other GitHub or downstream policy engines can consume
Cosign signing excerpt:
image-sign:
  steps:
    - name: Install Cosign
      uses: ./.github/actions/setup-cosign

    - name: Sign published image with GitHub OIDC
      uses: ./.github/actions/sign-published-image
      with:
        image-publish-ref: ${{ needs.image-publish.outputs.image-ref }}
        image-publish-digest: ${{ needs.image-publish.outputs.image-digest }}
        image-security-artifacts-path: ghcr-evidence/image-security
Inside that reusable action, the important logic is this:
- name: Attach image SBOM
  shell: bash
  run: |
    IMAGE_REPOSITORY="$IMAGE_PUBLISH_REF"
    IMAGE_REPOSITORY="${IMAGE_REPOSITORY%:*}"
    IMAGE_DIGEST="$IMAGE_PUBLISH_DIGEST"
    IMAGE_WITH_DIGEST="${IMAGE_REPOSITORY}@${IMAGE_DIGEST}"
    IMAGE_SBOM_FILE="$(find "$IMAGE_SECURITY_ARTIFACTS_PATH" -type f \( -name 'image.cdx.json' -o -name '*.cdx.json' \) | head -n 1)"

    cosign attach sbom --sbom "${IMAGE_SBOM_FILE}" "${IMAGE_WITH_DIGEST}"

- name: Sign image
  shell: bash
  run: |
    cosign sign --yes "${IMAGE_WITH_DIGEST}"
    echo "image_with_digest=${IMAGE_WITH_DIGEST}" >> "$GITHUB_OUTPUT"
So the helper does two concrete things: find the generated image SBOM in the downloaded evidence, attach it to the published digest, then sign that immutable digest and return it to later jobs.
Why sign the image instead of just trusting the registry? A registry tag can be moved or overwritten. A digest identifies exact content, but without a signature there is no proof that the CI workflow you trust actually produced and approved that content. Signing binds the digest to the CI workload identity. Later, the CD workflow verifies that signature again before deploy, so a compromised registry or retagged image cannot silently enter an environment. The same logic applies to the image SBOM: attaching it to the signed digest keeps the inventory evidence bound to the exact image it describes.
Cosign installation is wrapped too, but again the wrapper is intentionally minimal:
runs:
  using: composite
  steps:
    - name: Install Cosign
      uses: sigstore/cosign-installer@...
      with:
        cosign-release: ${{ inputs.cosign-release }}
That matters for maintainability more than logic. The workflow can pin one Cosign release in one helper and reuse that exact setup across app SBOM signing, image SBOM verification, image signing, and digest verification steps.
This adds GitHub-native supply-chain evidence around the same published artifact. The image SBOM is attached to GHCR, then Cosign keyless signing says more than “job succeeded.” It cryptographically ties the published image digest to the workload identity that created it. Detached SBOM bundle verification happened earlier so the raw SBOM files stayed compatible with Dependency-Track while still gaining provenance proof.
Signing and verification together close a loop that many pipelines leave open. Signing alone is ceremony if no one verifies before use. In this design, CI verifies once to create immediate evidence, then CD verifies again with a stricter identity check before runtime deployment. That second verification is the real control.
Why this matters in DevSecOps:
- GHCR remains source of truth not only for image tag, but also for attached SBOM evidence around same digest
- signatures help detect tampering between build and deployment
- keyless OIDC avoids long-lived signing key management for sample pipeline
- digest-based signing ensures exact artifact is trusted, not any later retagged image
- this is core supply-chain control, especially when registries, runners, and deployment systems are separate components
Verification excerpt:
verify-image-signature:
  steps:
    - name: Verify keyless image signature
      uses: ./.github/actions/verify-keyless-image-signature
      with:
        workflow-ref: ${{ github.workflow_ref }}
        image-with-digest: ${{ needs.image-sign.outputs.image-with-digest }}
And the reusable verification action is intentionally small:
- name: Verify signature
  shell: bash
  run: |
    cosign verify \
      --certificate-oidc-issuer "https://token.actions.githubusercontent.com" \
      --certificate-identity "https://github.com/$WORKFLOW_REF" \
      "$IMAGE_WITH_DIGEST"
    echo "image_with_digest=$IMAGE_WITH_DIGEST" >> "$GITHUB_OUTPUT"
That small wrapper matters because it standardizes the certificate identity check. Readers can now inspect the exact trust boundary instead of inferring it from prose.
This turns signing from ceremony into an enforceable control. Many teams sign artifacts but never verify them at all. In this sample, CI verification gives immediate artifact evidence, then CD performs verification again before deploy. That second verification is the actual environment gate.
One subtle but important difference exists between CI and CD verification now. CI verifies against the exact current workflow ref. CD verifies against a stricter certificate identity pattern that only trusts signatures originating from .github/workflows/ci.yaml on refs/heads/main or on tags. That keeps deployment trust anchored to the CI workflow identity, not only to the current CD run.
Why this matters in DevSecOps:
- it proves artifact was signed by expected GitHub workflow identity
- it blocks deploy if image was replaced, tampered with, or signed by wrong source
- it gives concrete trust gate before runtime exposure
- it prepares pipeline for later admission-control or cluster policy integration
This gives stronger trust story than simple docker push followed by deploy. CD now depends on signed and re-verified image metadata, not only on successful push.
Stage 9: CD deploy to dev or staging, validate runtime, then promote staging to production
CD now starts from workflow_run instead of manual dispatch. It downloads the ci-evidence artifact from the completed CI run, reads build-metadata.json, and decides whether deployment is enabled.
prepare-deployment:
  steps:
    - name: Download CI metadata
      run: |
        gh api "repos/$REPOSITORY/actions/artifacts/$artifact_id/zip" > ci-evidence.zip
        unzip -q ci-evidence.zip -d ci-evidence

    - name: Decide environment and digest
      run: |
        target_environment="$(jq -r '.deployment.targetEnvironment' ci-evidence/build-metadata.json)"
        image_with_digest="$(jq -r '.artifacts.signedImageWithDigest' ci-evidence/build-metadata.json)"
That handoff is what makes the split design useful. CI decides intent. CD consumes intent and deploys only trusted output.
Deployment itself still stays intentionally narrow. It does not rebuild or rescan. It deploys an artifact that has already passed quality, SAST, SCA, signing, and verification, and it deploys a verified immutable digest rather than a mutable tag.
The current CD flow has three important decisions:
- choose the environment from CI evidence:
devformain,stagingfor tags - choose the deployment target from environment variables: Azure Container Apps, AKS direct, or AKS plus Flux
- choose whether
productionis allowed: only after a successful staging deploy plus smoke, k6, and ZAP, and only after GitHub Environment approval
The deploy job reflects that directly:
deploy:
  environment: ${{ needs.prepare-deployment.outputs.target-environment }}
  steps:
    - name: Check deploy configuration
      env:
        DEPLOY_TARGET: ${{ vars.DEPLOY_TARGET }}
        AKS_DEPLOY_MODE: ${{ vars.AKS_DEPLOY_MODE }}
        TARGET_API_URL: ${{ vars.TARGET_API_URL }}
        AKS_TARGET_API_URL: ${{ vars.AKS_TARGET_API_URL }}

    - name: Deploy container image to Azure Container Apps
      if: steps.deploy_config.outputs.deploy_target == 'aca'

    - name: Deploy manifests to AKS directly
      if: steps.deploy_config.outputs.deploy_target == 'aks' && steps.deploy_config.outputs.deploy_mode == 'direct'

    - name: Update Flux-tracked AKS manifest in GitOps repo
      if: steps.deploy_config.outputs.deploy_target == 'aks' && steps.deploy_config.outputs.deploy_mode == 'flux'
Why this matters in DevSecOps:
- deployment should consume trusted artifact, not create new one
- separating deploy from build keeps release evidence easier to audit
- Azure login through federated identity avoids baking long-lived credentials into pipeline where possible
- environment-scoped variables such as
AZURE_RESOURCE_GROUP,CONTAINER_APP_NAME, and optionalTARGET_API_URLkeepdev,staging, andproductionconfiguration separate mainand tag promotions can share the same deploy logic while still landing in different environments- target selection through
DEPLOY_TARGET=aca|aksandAKS_DEPLOY_MODE=direct|fluxlets one CD workflow cover ACA, AKS direct, and AKS GitOps - post-deploy runtime validation now includes smoke plus k6 plus ZAP, not only ZAP
After deploy, CD runs smoke checks first, then a short k6 pass, then passive ZAP baseline scanning.
post-deploy-smoke:
  needs: [deploy]
  steps:
    - name: Run smoke checks against target API

post-deploy-k6:
  needs: [deploy, post-deploy-smoke]
  steps:
    - name: Run k6 target endpoint check

zap-baseline:
  needs: [deploy, post-deploy-smoke, post-deploy-k6]
  steps:
    - name: Run ZAP baseline scan
      uses: zaproxy/action-baseline@...
      with:
        target: ${{ needs.deploy.outputs.app-url }}
That runtime chain gives you three progressively more realistic checks:
- smoke proves the deployed endpoint is reachable and returns the expected JSON shape
- k6 adds a simple latency and stability gate against the real published URL
- ZAP checks the deployed HTTP surface from the attacker’s point of view
Why this matters in DevSecOps:
- some findings only appear once application is reachable over network
- smoke failures stop the lane before you waste time on heavier runtime checks
- k6 catches obvious stability or latency regressions on the actual deployed address
- passive DAST can catch headers, cookies, transport, and basic web exposure issues missed by static stages
- baseline mode keeps the pipeline practical for shared environments without a full authenticated test harness
- failing on alerts makes runtime posture part of release decision, not post-release surprise
The URL handling also changed in an important way. CD now uses TARGET_API_URL and AKS_TARGET_API_URL instead of the older staging-specific names, and it rejects URLs that contain embedded credentials, query strings, or fragments before writing them to workflow outputs or evidence artifacts.
Production is then a second deployment path, not a direct CI target:
deploy-production:
  if: >-
    needs.prepare-deployment.outputs.target-environment == 'staging' &&
    needs.zap-baseline.result == 'success'
  environment: production

post-deploy-smoke-production:
  needs: [deploy-production]

post-deploy-k6-production:
  needs: [deploy-production, post-deploy-smoke-production]

zap-baseline-production:
  needs: [deploy-production, post-deploy-smoke-production, post-deploy-k6-production]
That means a git tag does not jump straight to production. It lands in staging, proves the artifact works there, then pauses for the GitHub production environment approval before the same verified digest is promoted again.
Stage 10: Split Evidence, Notifications, and Workflow Handoff
The sample no longer has one shared finalizer. It now has one finalizer in CI and one finalizer in CD.
record-and-notify:
  if: always()
CI record-and-notify downloads test artifacts, security artifacts, the gate report, and then publishes ci-evidence. That bundle contains build-metadata.json, pipeline-summary.md, and pipeline-summary.json.
The current workflow uses a dedicated download-ci-evidence-artifacts composite action to restore the standard artifact layout before create-ci-evidence assembles the final handoff bundle.
That helper is deliberately boring, which is good. It only restores a predictable directory structure based on upstream job results:
- name: Download test results
  if: inputs.test-results-result == 'success'
  uses: ./.github/actions/download-workflow-artifact
  with:
    name: test-results
    path: ${{ inputs.base-path }}/test-results

- name: Download app security artifacts
  if: inputs.app-security-result != 'skipped'
  uses: ./.github/actions/download-workflow-artifact
  with:
    name: app-security-artifacts
    path: ${{ inputs.base-path }}/app-security

- name: Download image security artifacts
  if: inputs.image-security-result != 'skipped'
  uses: ./.github/actions/download-workflow-artifact
  with:
    name: image-security-artifacts
    path: ${{ inputs.base-path }}/image-security
That means the later evidence step does not need to know which earlier jobs ran, skipped, or failed. It can assume one stable folder layout and focus only on producing the final bundle.
CD record-and-notify downloads the ZAP report, publishes cd-evidence, and writes a deployment summary for the environment run.
The important detail is that ci-evidence/build-metadata.json is now more than a summary file. It is also the machine-readable handoff between workflows.
build-metadata.jsonfor machine-readable release context and deployment intentpipeline-summary.mdfor humans reading the artifact bundle or job summarypipeline-summary.jsonfor any later automation that wants one compact CI status documentcd-evidence/deployment-summary.*for runtime deployment and ZAP results
Why this matters in DevSecOps:
- audit evidence becomes first-class output, not incidental collection of scattered logs
- build metadata captures commit, branch, run, gate result, published digest, and intended target environment in one machine-readable document
- maintainers get one concise CI step summary and preserved evidence bundle, while operators get a separate CD deployment summary
- pull request runs still preserve CI evidence without triggering deployment
- later compliance or incident response work starts from preserved CI and CD evidence bundles instead of re-running pipeline mentally
- using
if: always()in both final jobs means evidence can still be assembled from partial success and failure paths instead of disappearing with the first blocking stage
Why These Stage Boundaries Work
What this split buys you:
- quality failures stay distinct from security failures
- IaC failures do not hide inside SAST or SCA noise
- app findings stay separate from image findings
- security gate turns multiple security signals into one explicit release decision
- publish never runs before the same source revision has passed app and image security gates
- deploy never runs on unsigned image
- CI and CD can evolve independently without collapsing back into one giant workflow file
- post-deploy runtime validation runs against the deployed artifact, not against a local guess
- release evidence is preserved as artifact instead of disappearing into transient job logs
- least-privilege job permissions reduce blast radius when one action or token is compromised
- path filters and concurrency keep the pipeline focused on meaningful changes instead of wasting runner time
It also scales well when team later adds policy exceptions, promotion environments, or admission control.
The security tools at a glance
Before the comparison tables, here is a one-line mental model for each tool that appears in this pipeline, grouped by what it inspects.
Code hygiene and secrets:
- Gitleaks scans repository history and content for leaked credentials and secrets
- Hadolint lints Dockerfiles for container hardening mistakes and bad practices
Static analysis (SAST) and IaC:
- Semgrep is a fast pattern-based static analyzer that catches dangerous code patterns across languages
- CodeQL is GitHub's deeper semantic analyzer for C#, with data-flow and taint tracking
- Checkov scans the delivery system itself: GitHub Actions, Dockerfiles, and secrets-style configuration
Application and image scanning (SCA):
- Trivy scans filesystems and container images for vulnerabilities, secrets, and misconfigurations in one pass
- Grype is a second package-level vulnerability scanner used as an advisory cross-check
- Snyk is an optional managed overlay with curated vulnerability intelligence and policy management
Runtime validation:
- k6 runs a short load and stability check against the deployed endpoint
- OWASP ZAP performs passive DAST against the deployed HTTP surface
Why this matters in DevSecOps: each tool answers one question about one surface. Keeping that mapping explicit is what makes the stage boundaries readable instead of a pile of scanner invocations.
SAST vs SCA vs DAST
The pipeline keeps three security categories separate because they inspect different artifacts at different times.
- SAST (Static Application Security Testing) analyzes source code without running it. It finds injection paths, unsafe API usage, and insecure patterns in the code the team writes. Semgrep and CodeQL are the SAST lanes here.
- SCA (Software Composition Analysis) analyzes dependencies and the packaged artifact. It finds known CVEs in NuGet packages, base image layers, and OS libraries the team did not write. Trivy, Grype, and Snyk are the SCA lanes, and SBOMs are their durable output.
- DAST (Dynamic Application Security Testing) probes the running application over HTTP. It finds issues that only exist once code is deployed: headers, cookies, transport, and exposed endpoints. ZAP is the DAST lane, and it runs only after deployment.
Why this matters in DevSecOps: the three categories cannot replace each other. SAST never sees the final image, SCA never executes the code, and DAST only sees what is reachable at runtime. A pipeline needs all three, and each stage in this article maps to exactly one category.
Tool Comparison
Quick comparisons help when readers want to understand why this sample uses several overlapping tools instead of only one scanner.
These are not universal rankings. They are fit-for-purpose notes for this pipeline shape: GitHub Actions, .NET workloads, GHCR publishing, Azure deployment, and staged DAST.
Quality and Secret Detection
| Tool | Role in this pipeline | Strength | Tradeoff or note |
|---|---|---|---|
dotnet format | formatting gate | deterministic, fast, low-noise | style-only, not security analysis |
| .NET analyzers | compile-time quality and API usage checks | native .NET feedback, easy to enforce with warnings as errors | not replacement for dedicated SAST |
| Gitleaks | secret detection in repository history and current content | strong early fail-fast control for leaked credentials | can need baseline tuning for false positives |
| Hadolint | Dockerfile linting | catches common container hardening mistakes early | focuses on Dockerfile patterns, not full image content |
IaC and Workflow Security
| Tool | Role in this pipeline | Strength | Tradeoff or note |
|---|---|---|---|
| Checkov | scans GitHub Actions, Dockerfile, and secrets-style policies | good left-shift coverage for delivery-system security | policy output can be noisy until teams tune rules |
| GitHub SARIF upload | publishes findings into GitHub Security tab | centralizes review experience in same platform as PRs | depends on tools producing clean SARIF categories |
SAST
| Tool | Role in this pipeline | Strength | Tradeoff or note |
|---|---|---|---|
| Semgrep | fast blocking SAST lane | broad rule coverage, simple CI gating, quick feedback | less semantic depth than CodeQL |
| CodeQL | deep semantic SAST for C# | strong data-flow analysis and GitHub-native integration | slower and heavier than pattern scanners |
| SonarQube / SonarCloud | optional quality and security hotspot lane | useful when teams already use Sonar governance and quality gates | extra platform dependency, not necessary for base sample |
Application and Image SCA
| Tool | Role in this pipeline | Strength | Tradeoff or note |
|---|---|---|---|
| Trivy | primary blocking scanner for app filesystem and image | open source, multi-target, covers vuln plus secret plus misconfig | results can overlap with other scanners, needs severity policy |
| Grype | advisory second opinion for package and image vulnerability review | useful cross-check against another vulnerability database and matcher | sample treats it as advisory to reduce duplicate blocking noise |
| Snyk | optional managed overlay for app and image scanning | strong policy management, curated vulnerability intelligence, good UI | requires token and paid-platform adoption for many teams |
SBOM and Dependency Inventory
| Tool | Role in this pipeline | Strength | Tradeoff or note |
|---|---|---|---|
| CycloneDX for .NET | generates application SBOM from solution and NuGet graph | clean fit for .NET dependency inventory and CycloneDX output | app-centric, not final container inventory |
| Syft (Anchore SBOM action) | generates image SBOM for built container surface | convenient image-focused SBOM generation inside Actions | separate from .NET project graph, so both outputs still matter |
| Dependency-Track | downstream SBOM consumption and monitoring | turns SBOM from static artifact into ongoing governance signal | adds external platform to operate, and Trivy datasource needs separate Trivy server |
Supply Chain Trust
| Tool | Role in this pipeline | Strength | Tradeoff or note |
|---|---|---|---|
| Cosign | keyless signing and verification of published image digest | strong modern signing model with GitHub OIDC and digest binding | teams must understand digest-based workflows, not only tags |
| GitHub artifact attestations | provenance evidence for produced artifacts | useful for traceability and later policy enforcement | still additional supply-chain layer many teams are learning |
| GHCR | registry target for published and signed image | tight GitHub integration for permissions and automation | registry choice does not replace signing or scanning requirements |
Deploy and Runtime Validation
| Tool | Role in this pipeline | Strength | Tradeoff or note |
|---|---|---|---|
| Azure Container Apps | staged deployment target | simple managed runtime for promoting verified image digests | runtime platform hardening still matters beyond pipeline checks |
| OWASP ZAP Baseline | passive DAST after deployment | easy first runtime check for headers, transport, and obvious web issues | baseline mode is lighter than authenticated or active DAST |
How to Read These Choices
If team wants smallest useful open-source stack, this sample can still work with Gitleaks, Hadolint, Checkov, Semgrep, CodeQL, Trivy, CycloneDX, Cosign, and ZAP.
If team already uses enterprise governance platforms, Sonar, Snyk, and Dependency-Track become strong overlays instead of mandatory foundation pieces.
For teams that want a local Dependency-Track lab instead of a managed instance, the sample repository includes a ready stack under deployments/dependency-track.
Local Developer Workflow
CI is strict, but local developer path is also covered.
This sample includes Husky.Net hooks so contributors catch issues before push.
dotnet tool restore
dotnet husky install
SOLUTION_PATH=DevSecOpsPipelineSample.slnx dotnet tool run husky -- run --name setup-solution-restore
This block brings part of security and quality discipline to developer machine. DevSecOps works better when some feedback happens before CI.
Why this matters in DevSecOps:
- catching format, analyzer, and test failures before push shortens feedback loop
- local hooks reduce avoidable CI churn and wasted runner minutes
- developers learn pipeline expectations earlier instead of discovering them only in remote job logs
- CI still remains source of truth, but local guardrails improve flow efficiency
Hooks live here:
Pre-commit runs formatting. Pre-push runs analyzers, build, and tests. CI still remains final policy gate.
Validation
Before treating pipeline as complete, validate these checks.
- GitHub Security tab receives distinct categories for Checkov, Semgrep, CodeQL, Trivy, Grype, and optional Snyk.
- Dependency-Track receives separate app and image SBOMs.
- Sonar lane skips cleanly when Sonar secrets are absent, or enforces Sonar gate when configured.
security-gatewrites report artifact and blocks publish when app or image security stage fails.- Checkov findings still upload SARIF before the job fails on policy violations.
- App and image SBOM files both produce detached Sigstore bundles and both bundles verify successfully on trusted non-PR runs.
- Published image in GHCR has attached image SBOM evidence, signed digest metadata, attestation metadata, and expected tags for the current ref strategy.
mainpushes publish short SHA tag plusdev,main, andlatest, while git tag pushes publish the git tag value.ci-evidence/build-metadata.jsoncontainssignedImageWithDigest,autoDeploy, and the expectedtargetEnvironment.- Successful
mainCI runs trigger CD and deploy todev, while successful tag CI runs trigger CD and deploy tostaging. productionstarts only after successful staging smoke, k6, and ZAP validation, and only after GitHub Environment approval.dev,staging, andproductionGitHub environments each provideAZURE_RESOURCE_GROUP,CONTAINER_APP_NAME, and optionalTARGET_API_URLvariables plus Azure OIDC secrets.- CD re-verifies the Cosign signature before deploy, rejects unsafe target URLs, and runs smoke, k6, and ZAP against the published endpoint.
- CI and CD each publish their own evidence artifacts:
ci-evidenceandcd-evidence. - Pull request runs still produce readable CI step summaries and
ci-evidenceartifacts without triggering deployment. - Local Dependency-Track stack starts cleanly from
deployments/dependency-track/docker-compose.yml, and Dependency-Track can reach Trivy athttp://trivy:8080with the configured token.
Local validation still starts simple.
dotnet test DevSecOpsPipelineSample.slnx
docker build -t devsecops-pipeline-sample .
This is the smallest useful validation loop outside GitHub Actions. It does not replace the full pipeline, but it confirms the app and image can at least be exercised locally.
Why this matters in DevSecOps:
- local reproduction reduces time spent debugging only in hosted runners
- validating buildability before pushing helps keep security scans focused on real candidate artifacts
- fast local verification is often first step when a pipeline stage fails and engineers need to narrow cause quickly
Conclusion
This pipeline is no longer just .NET build plus a few scanners. It is a layered CI/CD promotion workflow.
It starts with workflow-level guardrails, developer quality gates, IaC and SAST checks, splits app and image SCA correctly, adds centralized security gate, preserves SBOM and CI evidence, signs and verifies detached SBOM bundles, publishes trusted images to GHCR with Docker's official actions, attaches image SBOM to GHCR, signs published artifact with Sigstore Cosign, attests provenance, records deployment intent, then lets a separate CD workflow verify trust again before deploying to dev or staging, running smoke plus k6 plus ZAP, and promoting the same verified digest to production only after staging success and manual approval.
That shape is more useful than one huge job because each stage answers different question:
- is code healthy?
- is pipeline and Dockerfile safe?
- does source contain dangerous patterns?
- does the code meet broader quality and hotspot analysis expectations?
- do dependencies or runtime layers contain known risk?
- can deployed artifact be trusted?
- should this signed artifact go to
dev,staging, orproduction? - does the target endpoint show obvious runtime issues before promotion continues?
Tools may change over time. Stage boundaries should stay.
References
Article sample code is available here:
Useful references and related material: